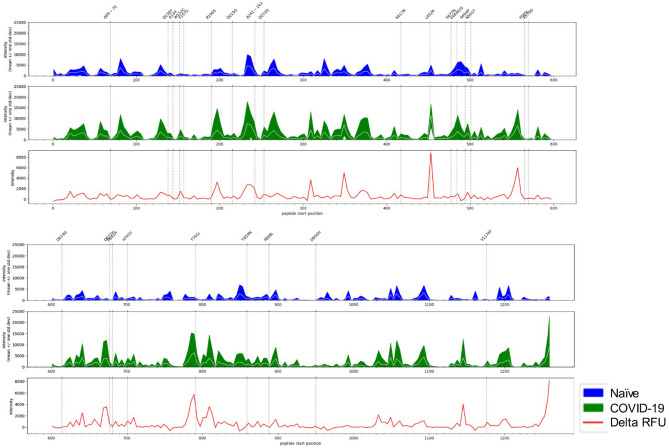
Figure 6.
Spike protein immunosignature reveals long-term antibodies bind key regions associated with emerging variants of concern. X-axis represents the linear protein sequence arranged N-terminus (left) to C-terminus (right). The top trio of panels represent positions 0 to 600, the bottom trio of panels represent positions 600–1273. The white line in the middle of the band represents the mean, while the width of the band represents ± 1 standard deviation. Values were generated using naïve serum samples (n = 20, blue band), and COVID-19 sera (n = 22; green band). Immunosignature showing differential reactivity (red line, delta relative fluorescent unit [delta RFU]) was generated by comparing the mean signal intensity of naïve sera to that of COVID-19 sera. Polymorphisms were retrieved from the Center for Disease Control.

