. 2022 May 6;4(3):e210105. doi: 10.1148/rycan.210105

Figure 6:

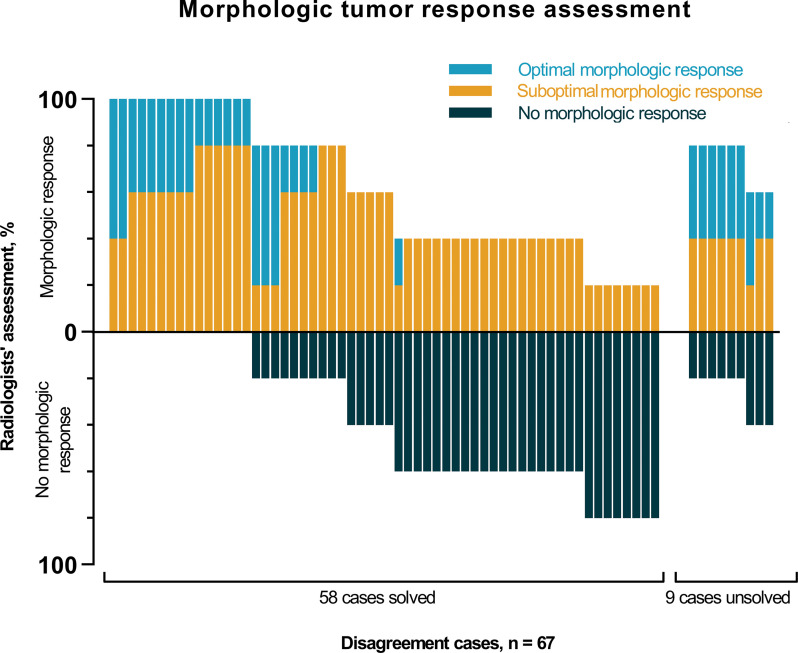
Bar chart depicts the morphologic tumor response assessment of the 67 disagreement cases of the three radiologists and the assessment by the two additional radiologists involved only in the disagreement cases’ assessment. Each bar represents one participant. The chart depicts the percentages of radiologists’ assessment for classifying participants as optimal morphologic response (blue), suboptimal morphologic response (orange), and no morphologic response (dark blue). Based on the majority of votes, 58 cases were solved and nine cases remained unsolved.

Bar chart depicts the morphologic tumor response assessment of the 67 disagreement cases of the three radiologists and the assessment by the two additional radiologists involved only in the disagreement cases’ assessment. Each bar represents one participant. The chart depicts the percentages of radiologists’ assessment for classifying participants as optimal morphologic response (blue), suboptimal morphologic response (orange), and no morphologic response (dark blue). Based on the majority of votes, 58 cases were solved and nine cases remained unsolved.