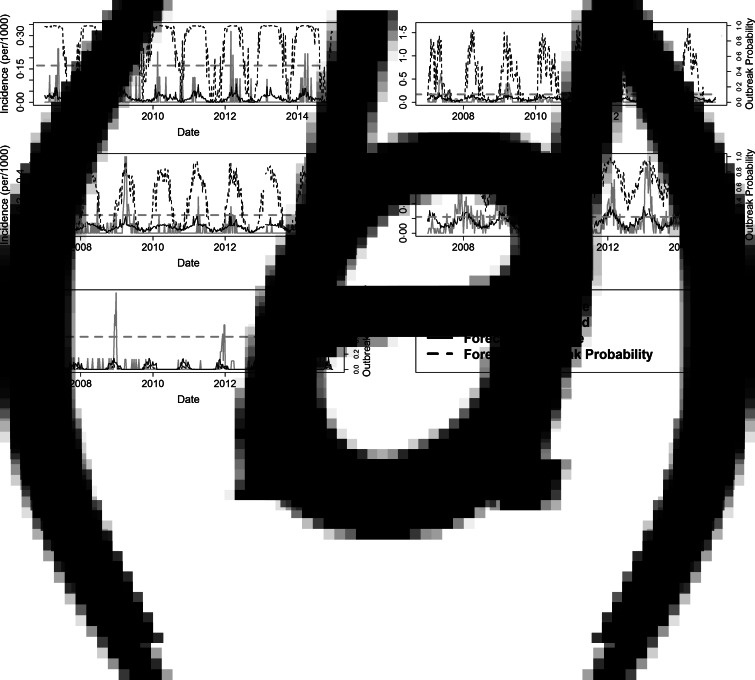
Fig. 2.
Outbreak probabilities and incidence across all sites. Observed incidence (left axis) plotted against the threshold, which defines and outbreak (left axis), predicted outbreak probabilities (right axis), and predicted incidence (per/1000 individuals, left axis) for a 7-year timespan from 2007 to 2014 for five sites in Western Australia: a, Derby; b, Broome; c, Port Hedland; d, Mandurah; e, Capel.

