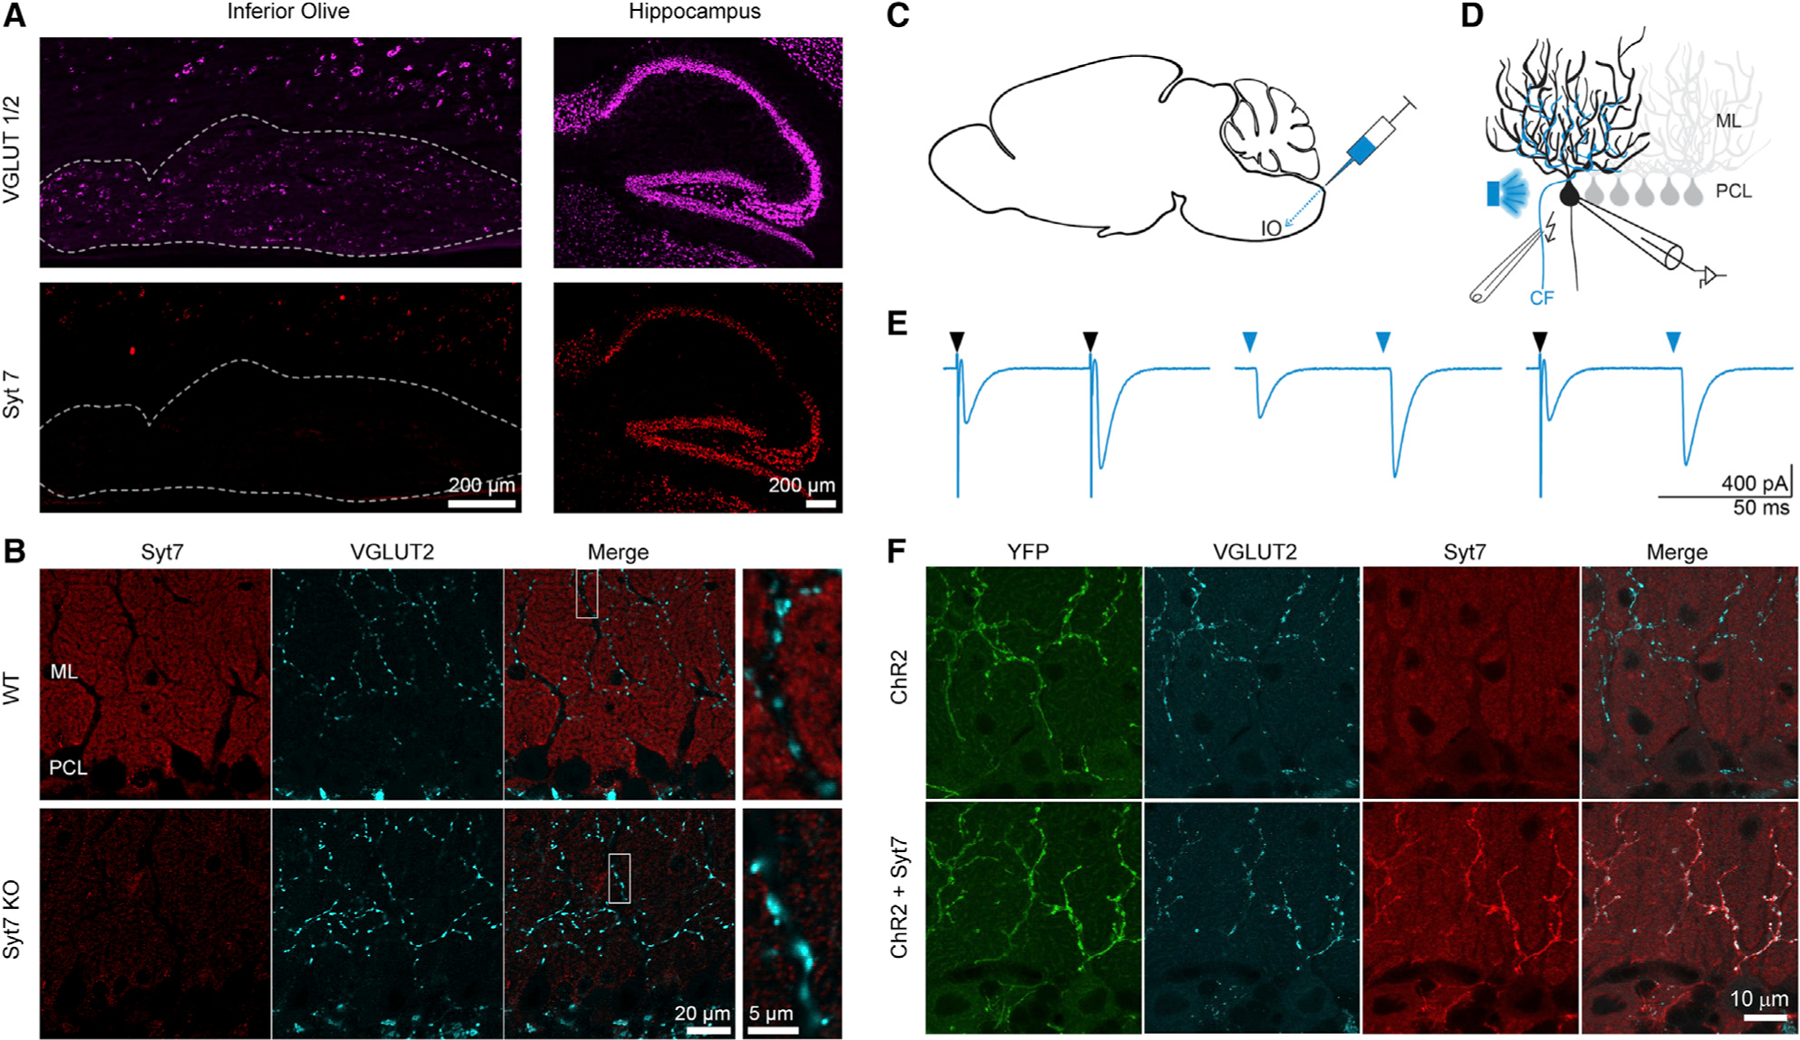
Figure 2. Syt7 expression in climbing fibers (CFs) with adeno-associated virus (AAV) infection of the inferior olive used to express Syt7 in CFs.

(A) Fluorescent in situ hybridization of WT mouse: labeling of vesicular glutamate transporter 1 and 2 (VGLUT1/2; magenta) and Syt7 (red) is shown in parasagittal slices for the inferior olive (IO) (left; dashed outline) and the hippocampus (right). ML, molecular layer; PCL, Purkinje cell layer. Both scale bars are 200 μm.
(B) Immunohistochemistry of WT (top) and Syt7 KO (bottom) parasagittal cerebellar slices. Syt7 (red), VGLUT2 (cyan), and the merge of the 2 channels are shown. The scale bar on the left is 20 μm, and the right scale bar is 5 μm.
(C) Schematic of intracranial brain injections of AAV9-ChR2 or AAV9-ChR2-Syt7 via the back approach targeting the IO (see STAR Methods).
(D) Schematic of the experimental electrophysiological recording setup in which AAV-infected CFs were identified by optical stimulation and experimentally tested by electric stimulation.
(E) Responses are shown for an AAV9-ChR2-Syt7-infected CF-PC synapse, following optical (light blue arrow) or electrical (black arrow) stimulation.
(F) Immunohistochemistry shows CF infection with AAV9-ChR2 (upper) and AAV9-ChR2-Syt7 (lower). The scale bar is 10 μm.
