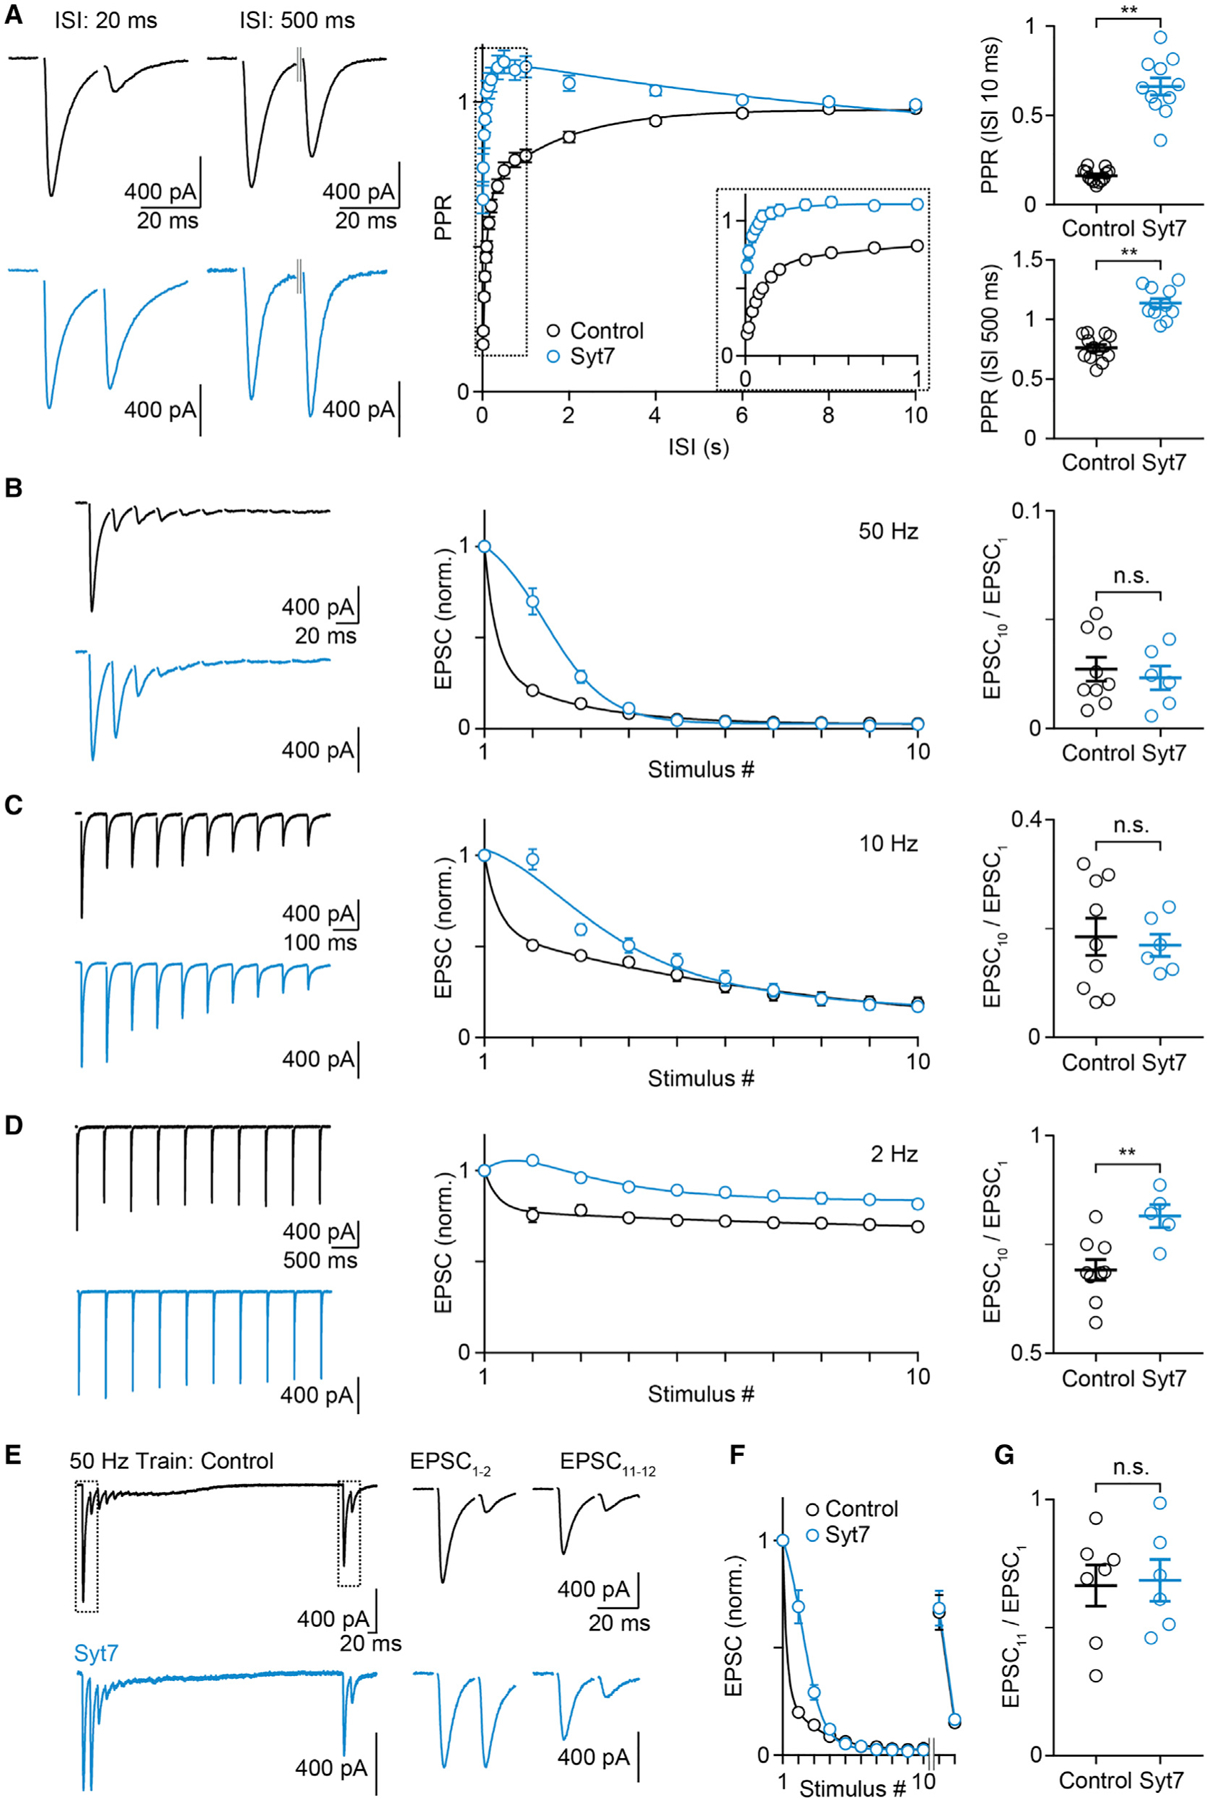
Figure 4. In high external calcium, Syt7 expression in CFs leads to changes in PPR and high-frequency trains without altering recovery after depletion.

Experiments were performed in ChR2- (black) and Syt7-ChR2 (light blue)-injected animals at the CF-PC synapse in 4 mM Cae.
(A–D) (Left) Representative EPSCs with an ISI of 20 ms (A, left), 500 ms (A, middle left), or EPSCs evoked by a 50-Hz (B), 10-Hz (C), or 2-Hz (D) train are shown. (Middle) The average PPR is plotted as function of the ISI (A), and summaries for the normalized average EPSC amplitudes are shown for 50 Hz (B), 10 Hz (C), and 2 Hz (D) trains. (Right) Mean ± SEM for the PPR at 10 and 500 ms (A) and the EPSC10/EPSC1 ratio (B–D) are shown.
(E) Responses evoked by a 50-Hz train (EPSCs 1–10) followed by a 500-ms pause and then with a pair of pulses with a 20-ms ISI (EPSCs 11 and 12).
(F) Summary for experiments as in (E).
(G) Summary of mean ± SEM for EPSC11 / EPSC1.
Statistical significance (unpaired t test; see Table S1): n.s.; **p < 0.01. Data are shown as mean ± SEM. Fits are as mean ± SD. See also Figure S5 and Table S1.
