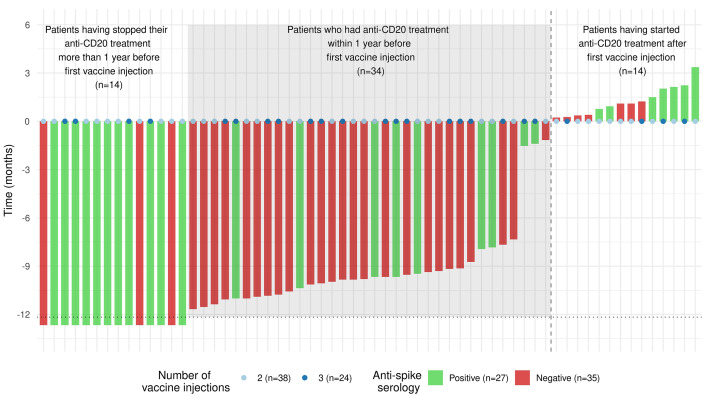
Figure 1.
Time interval between the first vaccine injection and the last (if prior to vaccination) or first (if afer vaccination) anti-CD20 administration. Time is represented by vertical bars and the color code represents patients’ serological status. Patients who had their last anti-CD20 administration before their first vaccine injection are represented at the left hand side of the vertical dotted line. Patients who had their last anti-CD20 administration after their first vaccine injection are represented at the right hand side of the vertical dotted line. The color code of the vertical bars represents patients’ serological status. The total number of vaccine doses received prior to serology is represented by colored points (2 doses or 3 doses).

