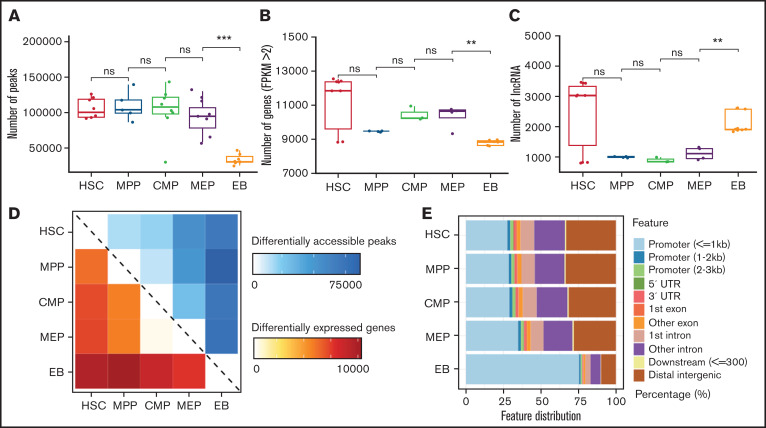
Figure 1.
Dynamic changes in chromatin accessibility and the transcriptome during erythroid differentiation. (A) Peaks in ATAC-seq data. The boxplot illustrates the number of accessible chromatin regions at each stage during erythroid differentiation. (B) Number of genes at each stage from RNA-seq data with FPKM >2. (C) Number of lncRNAs at each stage during erythroid differentiation. (D) Heatmap showing the number correlation of differentially accessible peaks of chromatin (top, blue) and differentially expressed genes (bottom, red) during erythroid differentiation. (E) Genomic distribution features of accessible chromatin. The bar plot shows the percentage of ATAC-seq peaks intersecting with the promoter, UTR, exon, intron, and distal intergenic. Statistical results were analyzed using a Kruskal-Wallis test.

