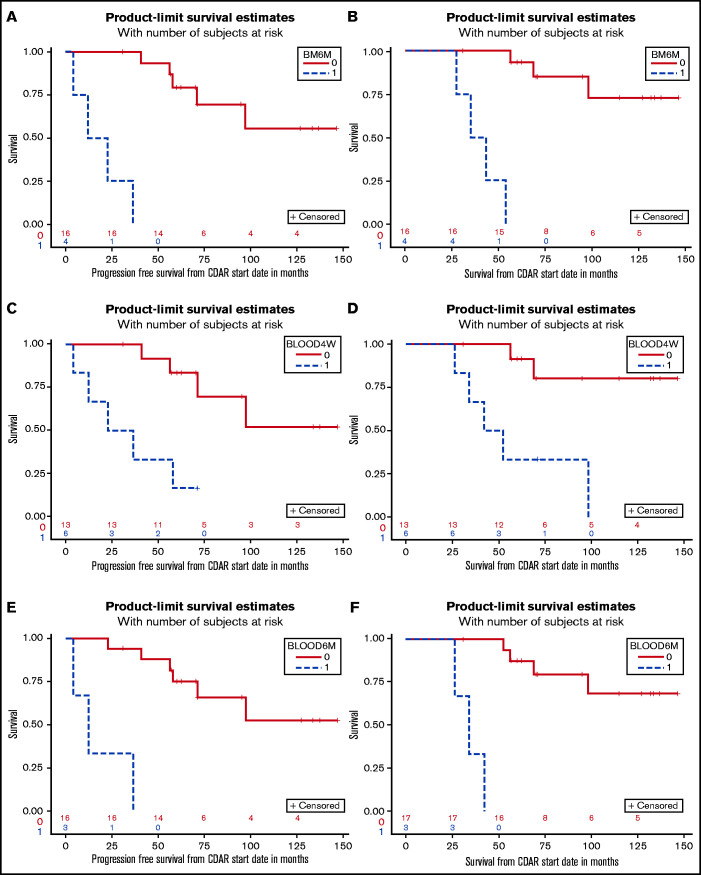
Figure 3.
Survival outcomes by MRD status. Patients with HCLv achieving (n = 16, red) or not achieving (n = 4, blue) MRD-negative CR at 6 months are compared with respect to PFS (A) and OS (B). Similarly, PFS (C, E) and OS (D, F) are shown for patients who were blood MRD-negative (n = 14, red) vs positive (n = 5, blue) at 1 month (C, D), and blood MRD-negative (n = 17, red) vs positive (n = 3, blue) at 6 months (E, F). Patient #11 experienced progression at 4.1 months and is included in the analyses of PFS and OS curves based on results at 6 months because the patient was blood MRD positive at both 1 and 6 months. These 2 sets of analyses could have been done starting at 6 months after beginning treatment to ensure that the trait was considered at the start of the curves but doing so would have eliminated this patient from the PFS curves in panels A and E, and it was judged to be more important to show these full results.

