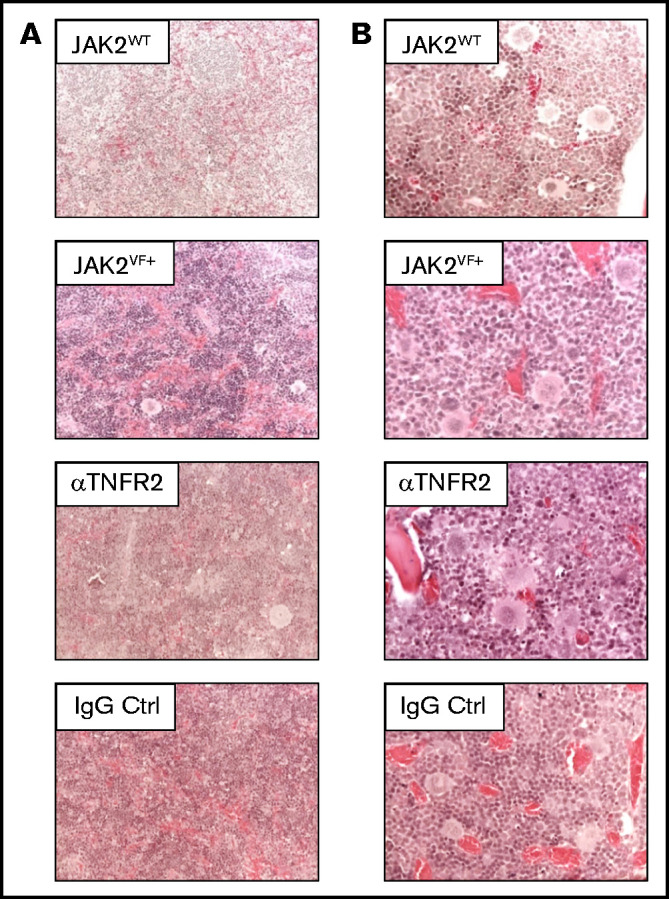
Figure 2.

Splenic and bone marrow structure in JAK2+/VF mice after αTNFR2 treatment. (A) Representative pictures of hematoxylin and eosin–(H&E)-stained spleen sections from untreated JAK2WT(n = 1), untreated JAK2VF mice (n = 2) and JAK2+/VF mice treated with αTNFR2 antibody (n = 3) or IgG (n = 3); original magnification ×200. (B) Representative photomicrographs of H&E-stained bone marrow sections from untreated JAK2WT (n = 1), untreated JAK2VF mice (n = 2) and JAK2+/VF mice treated with αTNFR2 antibody (n = 3) or IgG (n = 3); original magnification ×400. Ctrl, control.
