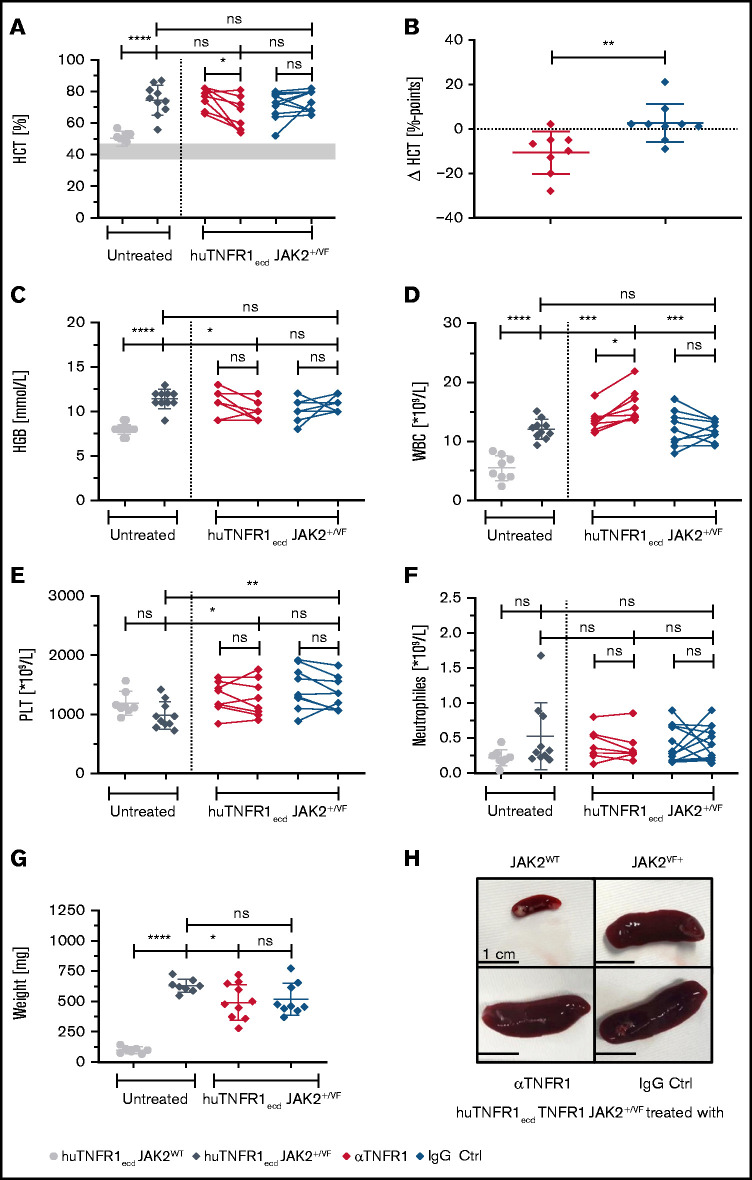
Figure 4.
MPN disease parameters upon 3 weeks of treatment using an αTNFR1 antibody. huTNFR1ecd × JAK2+/VF mice were treated intraperitoneally, 20 mg/kg body weight, 3 times a week for 3 weeks with an anti-human TNFR1 antibody (clone H398; Institut fur Zellbiologie un Immunologie Stuttgart) or an IgG2a isotype control Ab (clone C1.18.4). Blood counts were analyzed weekly during the treatment phase. All antibody-treated huTNFR1ecd × JAK2+/VF mice were 12 or 13 weeks old at the end of therapy; huTNFR1ecd × JAK2WT mice and huTNFR1ecd × JAK2+/VF mice were age matched (11-15 weeks). (A-F) HCT and blood count analysis of untreated huTNFR1ecd × JAK2+/VF mice (n = 10) and JAK2WT mice (n = 8) and huTNFR1ecd × JAK2+/VF mice treated with αTNFR1 antibody (n = 8) or IgG (n = 9). (B) Change in HCT (ΔHCT) in αTNFR1-treated mice and corresponding control group. Differences between HCT at the start and end of the treatment phase in αTNFR1-treated mice and IgG control mice (Δ HCT = HCTEnd − HCTStart). (G) Spleen weights for untreated huTNFR1ecd × JAK2+/VF mice (n = 8) and JAK2WT mice (n = 7) and huTNFR1ecd × JAK2+/VF mice treated with αTNFR1 antibody (n = 9) or IgG (n = 9). (H) Representative photographs of spleens from untreated huTNFR1ecd × JAK2WT mice (n = 3) and huTNFR1ecd × JAK2+/VF mice (n = 3) and huTNFR1ecd × JAK2+/VF mice treated with αTNFR1 antibody (n = 5) or IgG (n = 5). *P < .05, **P < .01, ***P < .001, ****P < .0001. ns, not significant.

