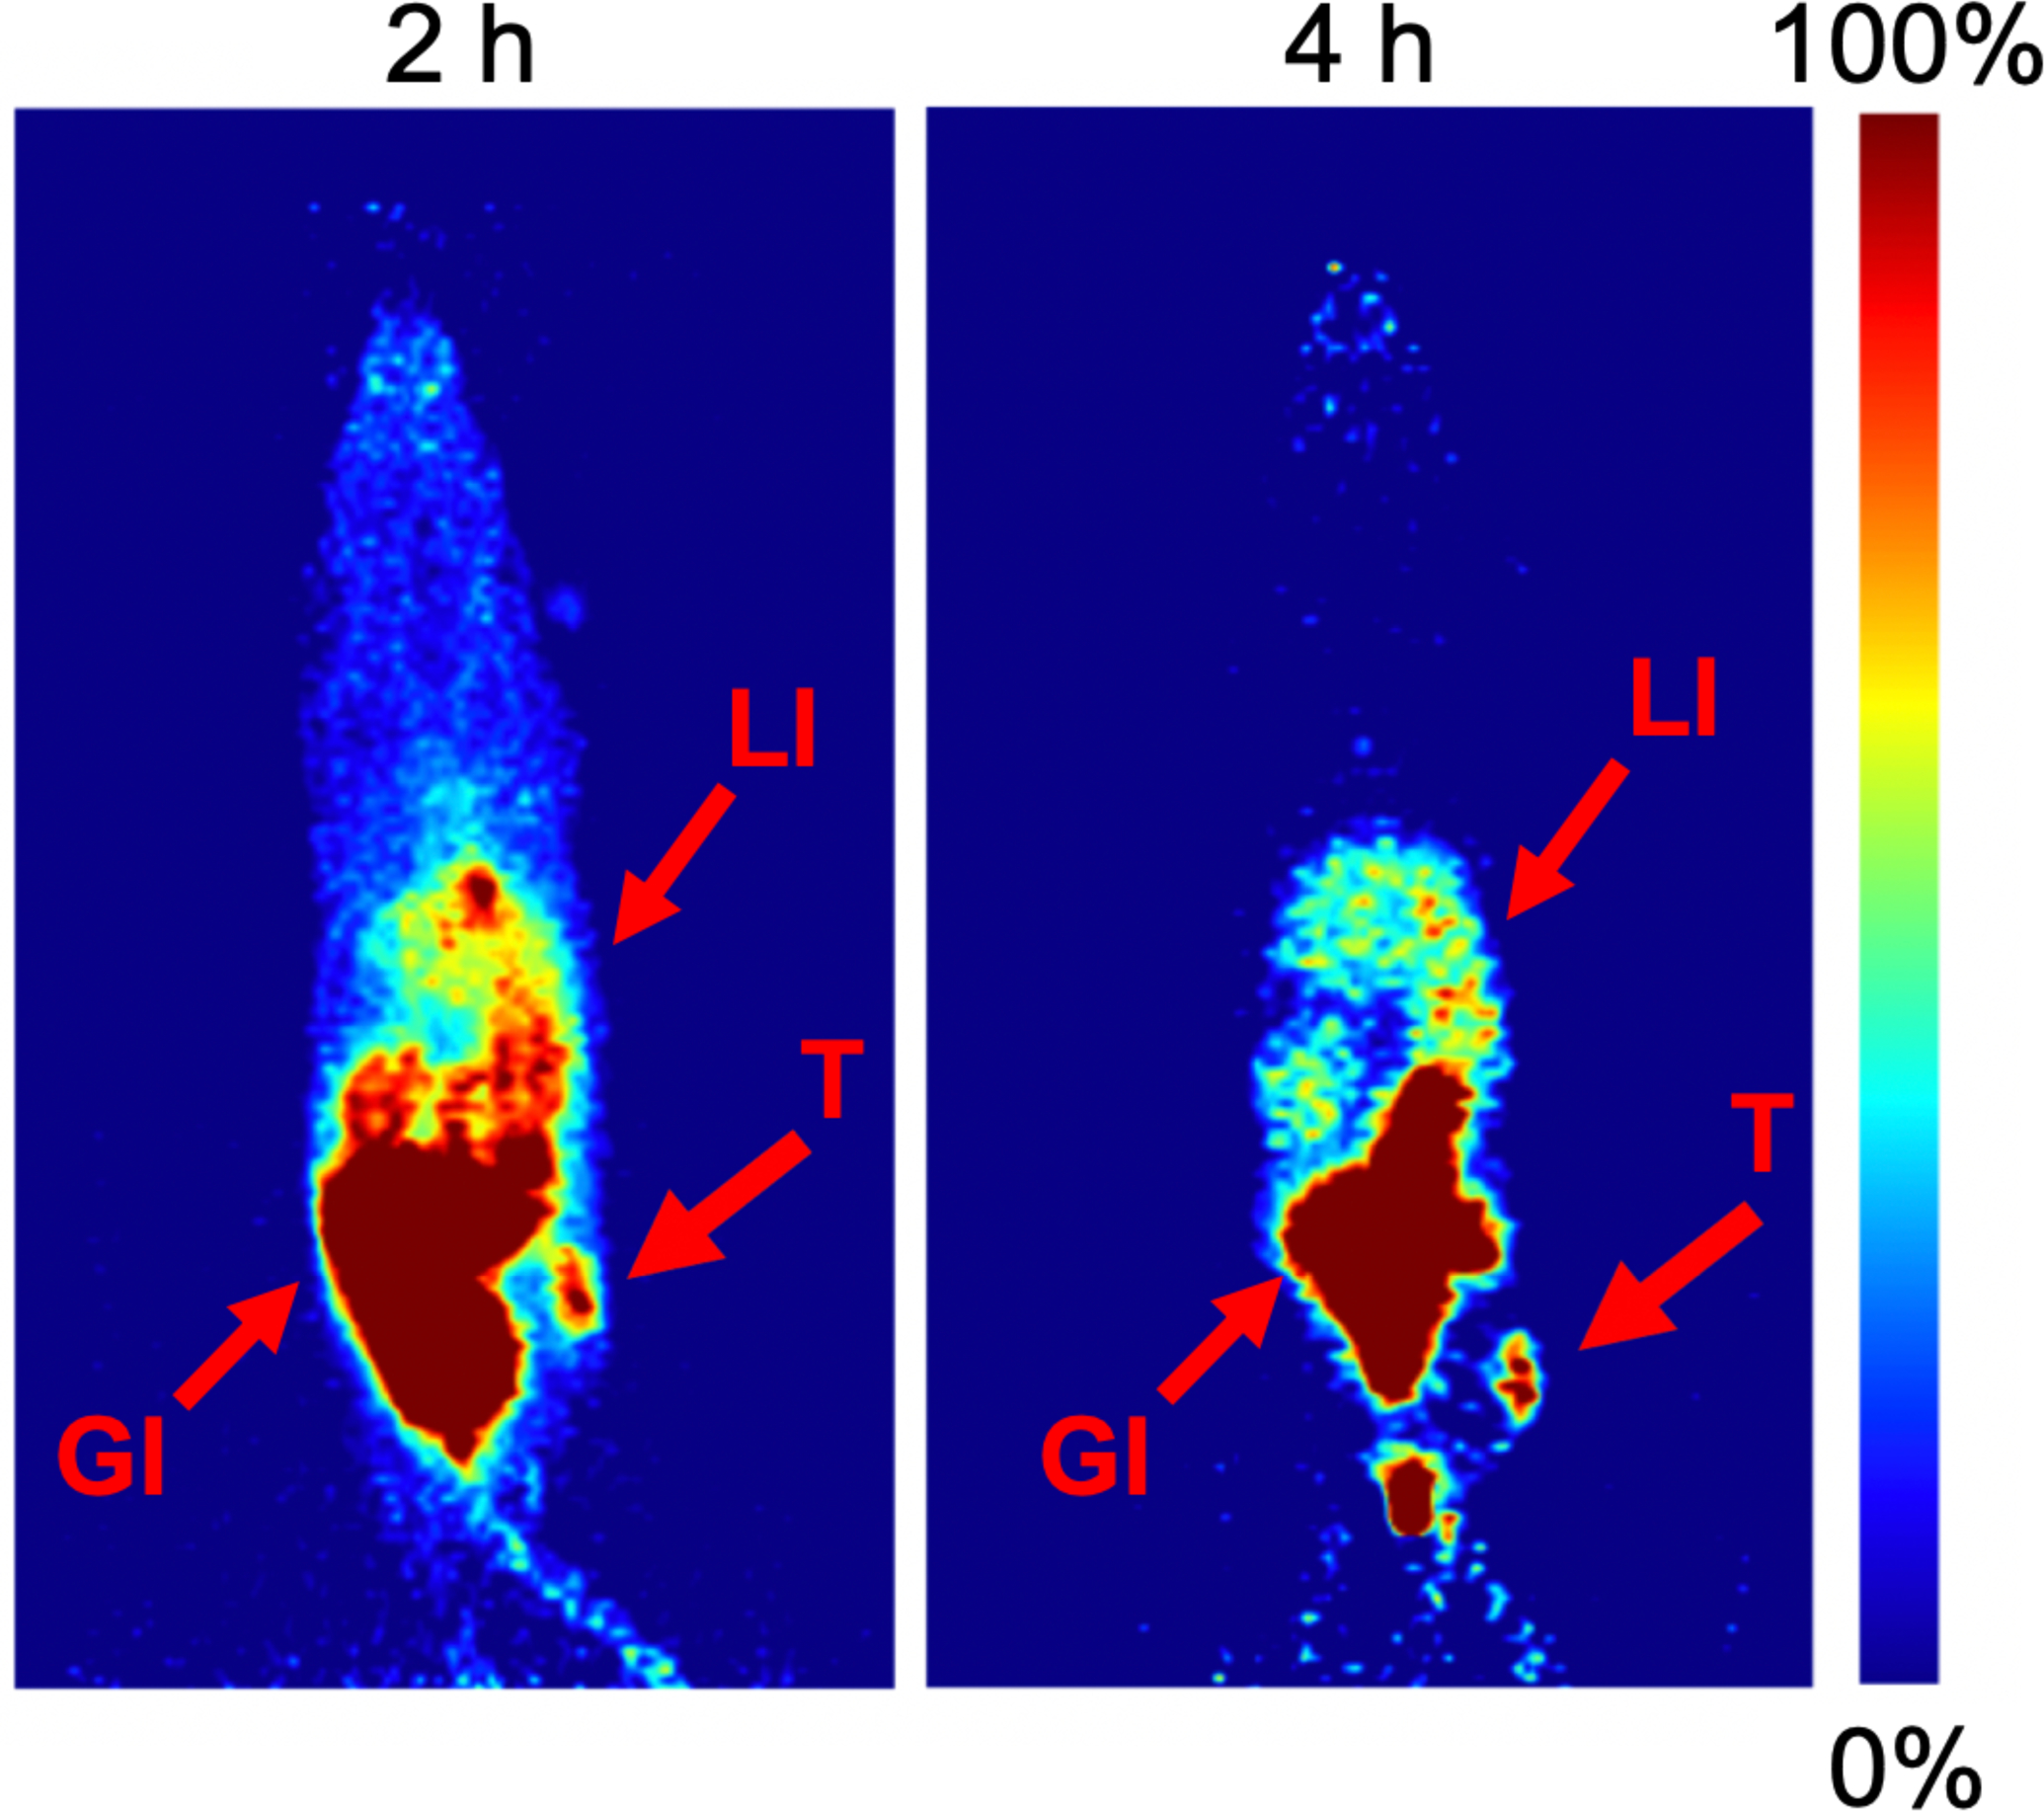
FIGURE 5.

Maximum intensity projection images of female BxPC3 xenografted nude mice administered with CB7-M5A 72 hours prior to [68Ga]Ga-NOTA-PEG3-NMe2-Fc. The time values represent the amount of time after the radioligand administration and the arrows indicate the location of tumor (T), liver (LI) and gastrointestinal tract (GI). In order to visualize the tumor at both timepoints, different thresholds were used for displaying the image.
