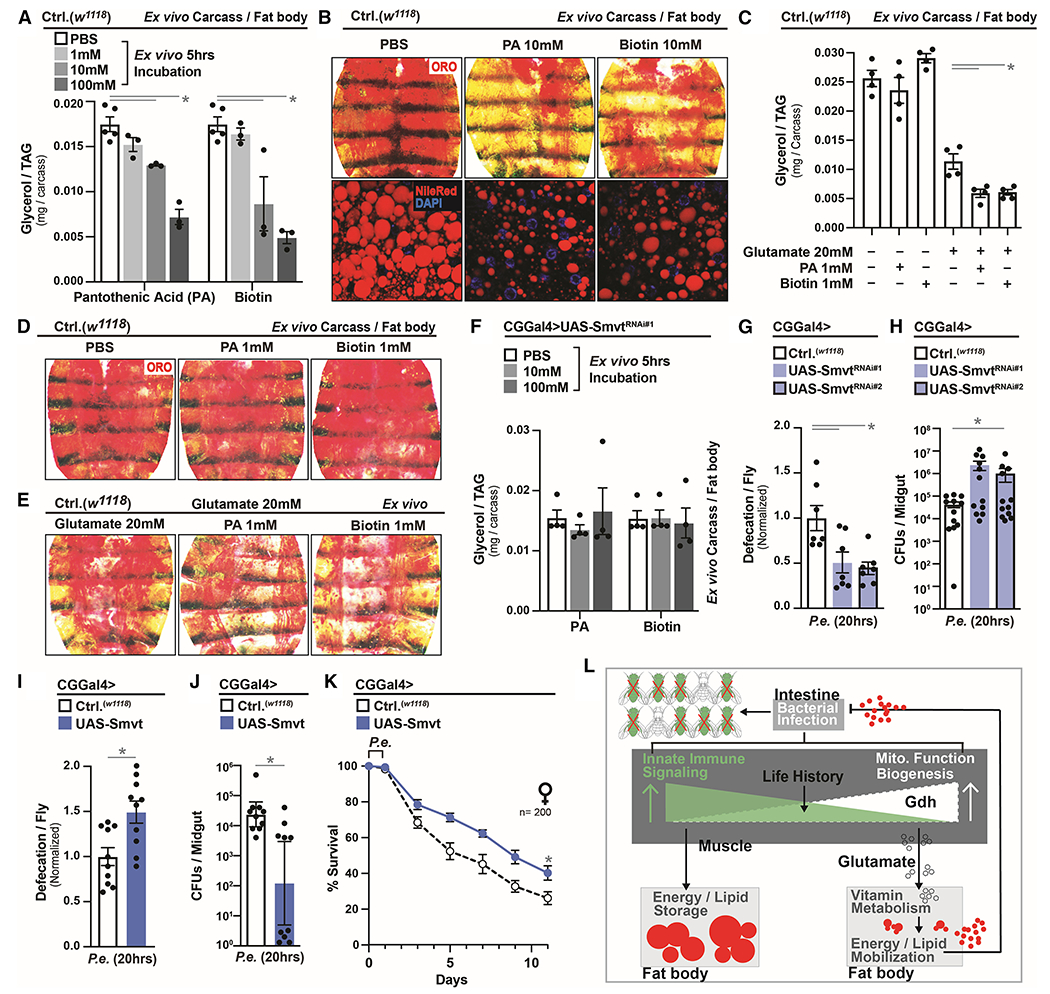
Figure 7: Smvt-mediated Vitamin Metabolism Directs Re-allocation of Host Energy Substrates to Alter Host-Pathogen Susceptibility.

(A-B) Changes in lipid metabolism in dissected w1118 carcass/fat body after ex vivo incubation with the indicated concentration of pantothenic acid (PA) or biotin for 5 hrs. (A) Total TAG levels of carcass/fat body; n=3. (B) Neutral lipid (ORO) stain.
(C-E) Changes in lipid metabolism in dissected w1118 carcass/fat body after ex vivo incubation with the indicated concentration of glutamate, PA or biotin for 5 hrs. (C) Total TAG levels of carcass/fat body; n=3. (D-E) Neutral lipid (ORO) stain.
(F) Total TAG levels in dissected carcass/fat body of CGGal4>UAS-SmvtRNAi#1 flies after ex vivo incubation with the indicated concentration of PA or biotin for 5 hrs; n=4.
(G-H) Infection resistance of CGGal4>UAS-SmvtRNAi#1/UAS-SmvtRNAi#2 flies after P.e. oral infection. Measurement of (G) defecation; n=140, and (H) CFUs; n=12.
(I-K) Infection outcomes of CGGal4>UAS-Smvt flies after P.e. infection. Measurement of (I) defecation; n=200, (J) CFUs; n=10, and (K) survival rates; n=200.
(L) Model summarizing conclusions.
Error bars represent mean±SE, *P<0.01.
