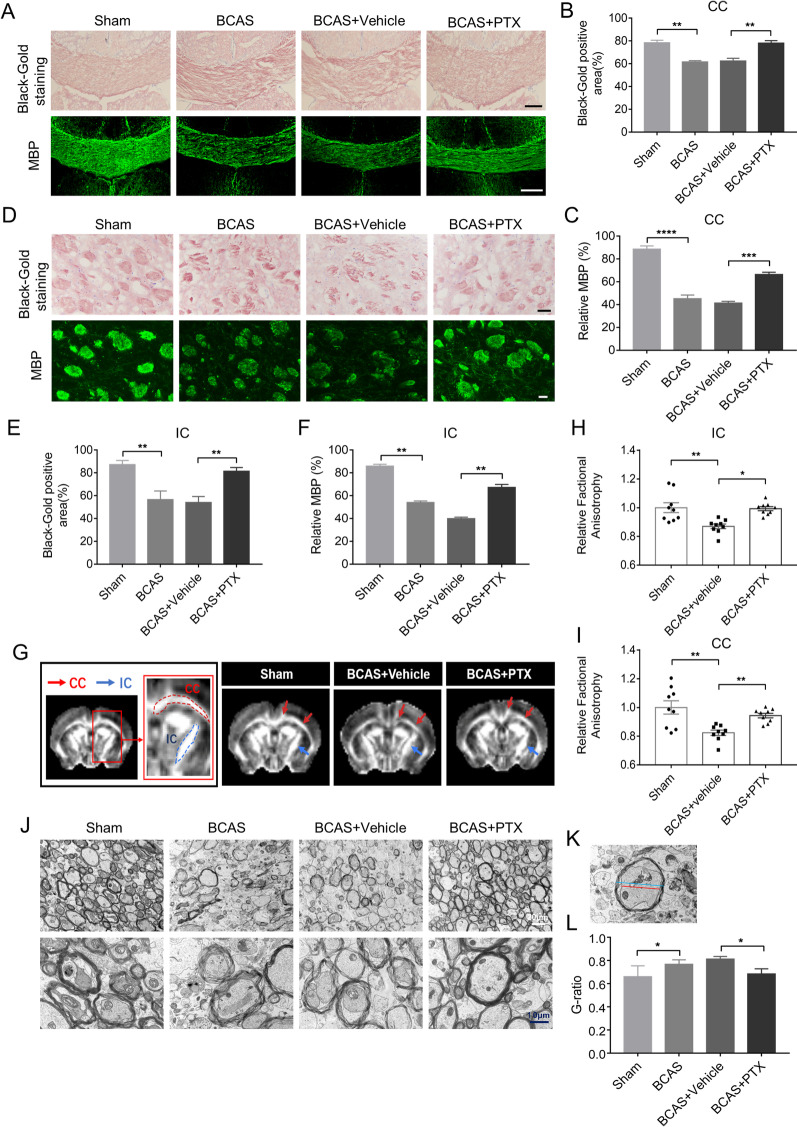
Fig. 2.
PTX alleviated white matter damage after BCAS. A Representative images of black-gold staining (lavender) and myelin basic protein (green) in corpus callosum (CC) at Day 30 after BCAS. Scale bar: 200 μm. D Representative images of black-gold staining (lavender) and myelin basic protein (green) in internal capsule (IC) at Day 30 after BCAS. Scale bar: 50 μm. B, E Quantification of immunofluorescent intensity of black-gold staining area in CC and IC (n ≥ 3 mice per group). C, F Quantification of immunofluorescent intensity of MBP area in CC and IC (n ≥ 3 mice per group). G Representative images of FA maps of mice brain; Red arrows indicate the CC, Blue arrows indicate the IC. H, Quantification of FA value in IC (n = 9 mice per group). I Quantification of FA value in CC (n = 9 mice per group). J Representative images of Electron microscopy in IC. K Schematic diagram showing the diameter of the axon (red line) and the diameter of the entire myelinated fiber (blue line). L Quantification of G-ratio (n ≥ 4 mice per group). All data were presented as the mean ± SEM. *p < 0.05, **p < 0.01, ***p < 0.005, ****p < 0.001

