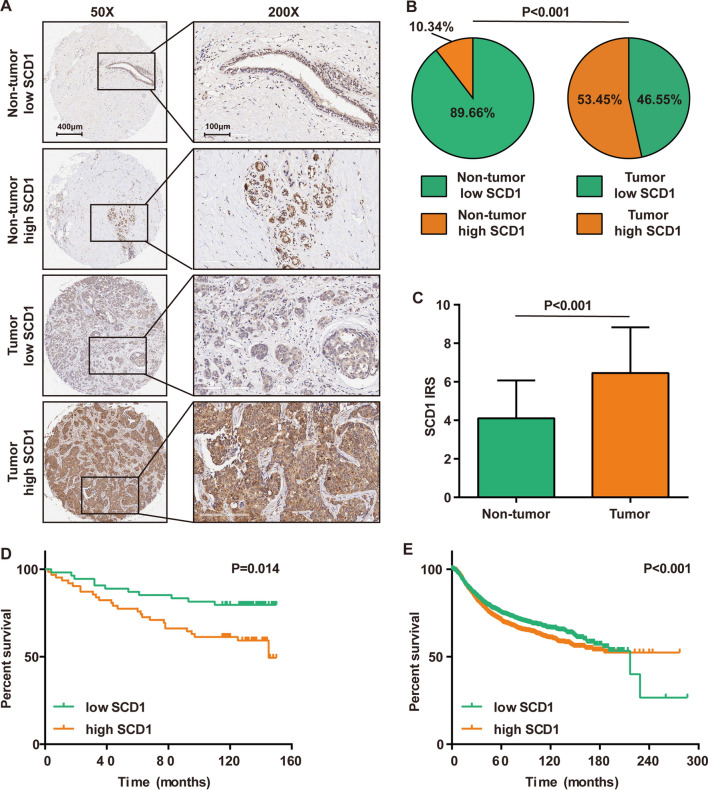
Fig. 1.
SCD1 expression in breast cancer and its prognostic value. A Representative microphotographs revealing SCD1 expression status using anti-SCD1 IHC staining. Brown, SCD1; Blue, hematoxylin. B The proportion of SCD1 expression status in tumor and nontumor samples. Low expression, IRS ≤ 6; High expression, IRS > 6. C Comparison of SCD1 expression in tumor and nontumor samples. D Survival analysis showing overall survival curves of patients with low SCD1 expression vs. high expression in breast cancer. Low expression, IRS ≤ 6; High expression, IRS > 6. E Online Kaplan–Meier Plotter analysis showing relapse-free survival curves of patients with low SCD1 expression vs. high SCD1 expression in breast cancer

