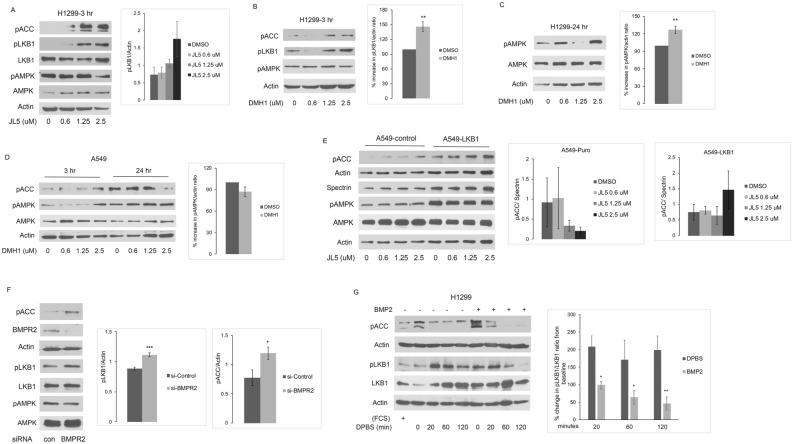
Fig. 3.
BMP suppresses LKB1 in lung cancer cells. A, B Western blot analysis of H1299 cells treated with JL5 or DMH1 demonstrating an increase in pACC and LKB1 at 3 h. Graph represents the mean pLKB1 expression normalized to Actin, n = 3. B Representative immunoblot. Mean percent increase in pLKB1/Actin ratio compared to control at 3 h following treatment with DMH1, n = 3. C Immunoblot of H1299 cells treated with DMH1 for 24 h. Mean percent increase in normalized pAMPK expression compared to control at 24 h following treatment with DMH1, n = 3 D Immunoblot of A549 cells treated with DMH1 for 3 and 24 h, (n = 3) demonstrating no significant change in pACC or pAMPK. The pLKB1, pAMPK, and Actin bands scanned were the 2.5 µM concentration except for one 1.25 µM peak value band obtained from H1299 cells treated with DMH1 for 3 h. E Western blot analysis of A549 cells stably expressing LKB1 and A549 control transfected cells treated with JL5 for 24 h. Both Actin and spectrin were used as loading controls. Graph represents mean pACC/spectin ratio, n = 2. F Immunoblot of H1299 cells following siRNA knockdown of BMPR2. Graph represents the mean of 4 independent studies. G Western blot analysis of starved H1299 cells treated with and without BMP2 ligand. Graph represent the mean change in pLKB1/pLKB1 ratio compared to control over time, n = 3

