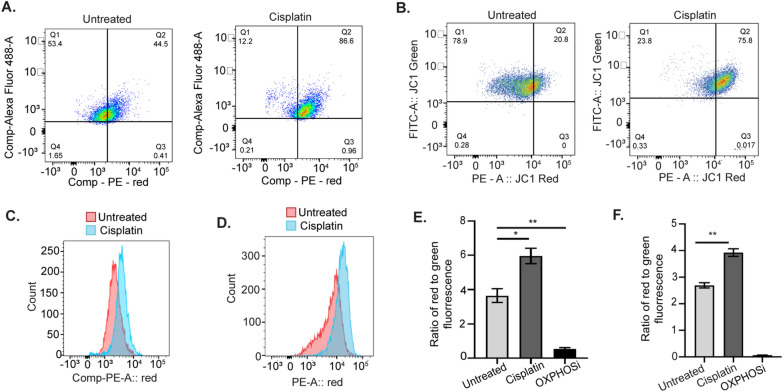
Fig. 1.
Mitochondrial OXPHOS activity increases in response to cisplatin treatment in OC cells. Scatter plots of OVCAR5 (A) and OVSAHO (B) cells untreated or treated with 12 µM and 4 µM cisplatin, respectively, for 16 h followed by staining with JC-1 for 30 min and analysis by flow cytometry. Histogram of untreated and cisplatin treated OVCAR5 (C) and OVSAHO (D) cells after JC-1 staining as in A and B. Ratio of red to green fluorescence intensity in untreated and cisplatin treated OVCAR5 (E) and OVSAHO (F) cells after JC-1 staining as in A and B. The OXPHOS inhibitor carbonyl cyanide 3-chlorophenylhydrazone (OXPHOSi) was used as an assay control. Graphs display mean ratio of red to green fluorescence ± SEM (N = 3). Student t-test was used to calculate statistical significance. For all untreated versus cisplatin treated, P values *< 0.05, **< 0.005 and ***< 0.0005

