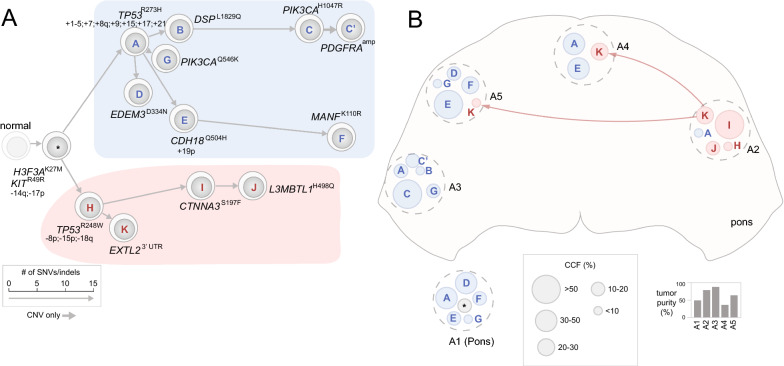
Fig. 3.
Early divergence defined by convergent evolution of TP53 mutations in patient 325. A A phylogenetic tree constructed from multi-region tumor samples with clones represented as cells and arrows indicating evolutionary branches. The founder clone comprised of truncal variants is shown in gray marked by a “*” from which the major branches are highlighted by distinct colors, i.e. the two major branches bearing TP53R273H and TP53R248W shown in blue and pink, respectively. The length of each branch is drawn proportional to the number of somatic SNVs/indels in its lineage-specific mutation cluster (details of the clusters are shown in Additional file 2: Fig. 7A). The clones are marked alphabetically by their corresponding mutation clusters with selected mutations labeled, along with chromosome/arm-level somatic CNV gains indicated with “+” and losses with “−”. B Clonal composition of each tumor region. Each tumor region is marked by a dotted gray circle placed to its spatial position viewed from the top (transverse plane). Clones within each region are shown as circles colored and labeled by their lineages on the phylogenetic tree shown in (A). A founder clone marked by “*” may also represent an unknown subclone with undetected private mutations. The diameter of each circle corresponds to the size of the clone (legend at bottom). A1 was a tumor region within pons with unknown position and is shown outside the pons. Invasion of clone K of pink branch from A2 is shown by pink arrows. Tumor purity of each sample is indicated as a bar graph below

