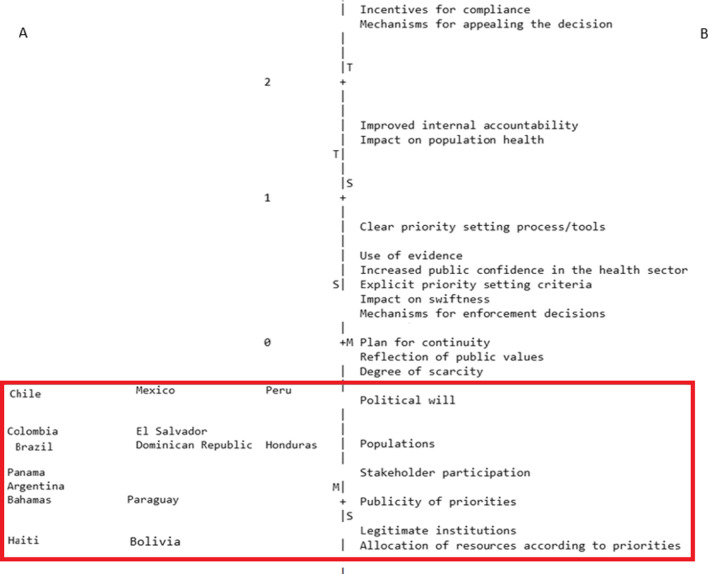
Fig. 3.
Wright map. The figure has two sides separated by a punctuated line. Side A has the country plans, and side B the parameters. Parameters over zero indicate they are less likely to be found in the response and preparedness plans; for instance, incentives for compliance and mechanisms for appealing the decisions were the least likely to be found in the reviewed plans. Countries are also ordered by level of trait; the countries on the top of the figure are those whose plans identified the greatest number of parameters, including those that were least likely to be found in the other plans. Overall, the figure shows that all the sampled country plans included only a few parameters (the red box)

