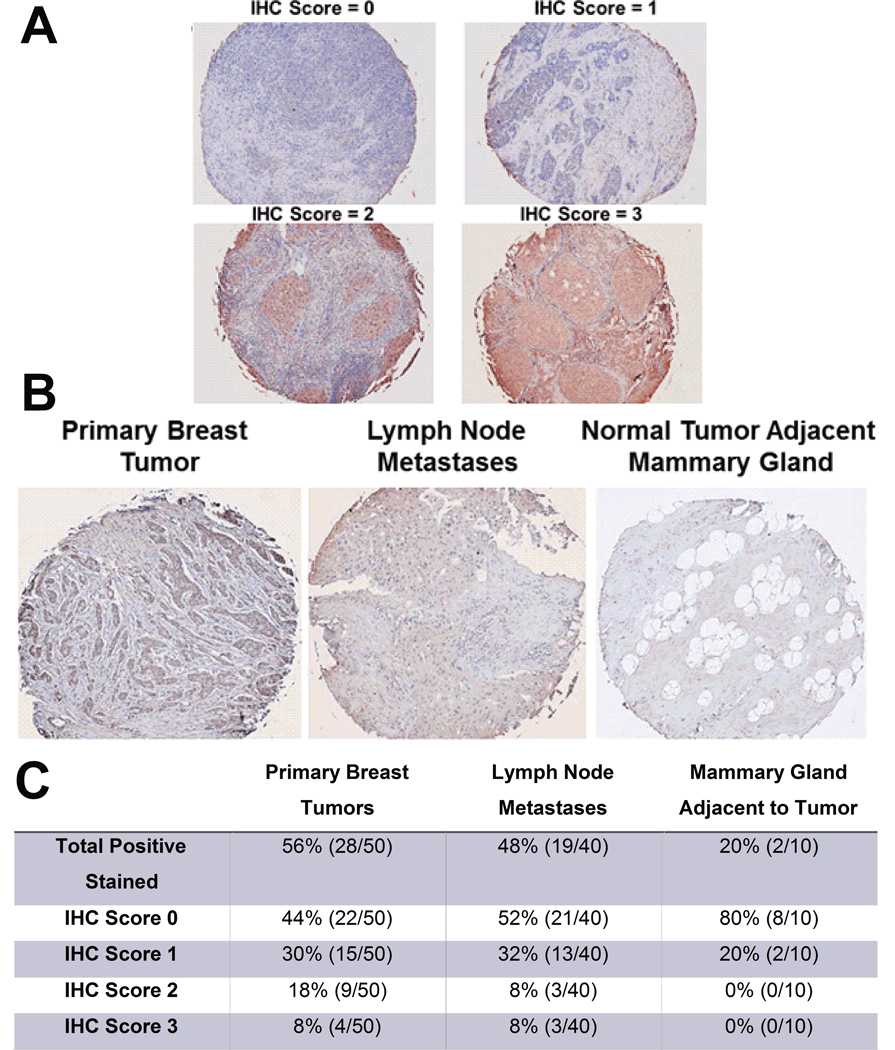
Figure 3.
Elevated P. aeruginosa abundance in primary breast tumors and lymph node metastases when compared with normal surrounding mammary gland tissue. A. Representative images of primary breast tumors with differential P. aeruginosa IHC scoring B. Representative images of primary breast tumors and lymph node metastases, and normal tumor adjacent mammary gland tissue stained with an anti-Pseudomonas aeruginosa antibody. C. Table of the quantified P. aeruginosa tissue staining. Percentages and total number of cases shown. n=10–50.

