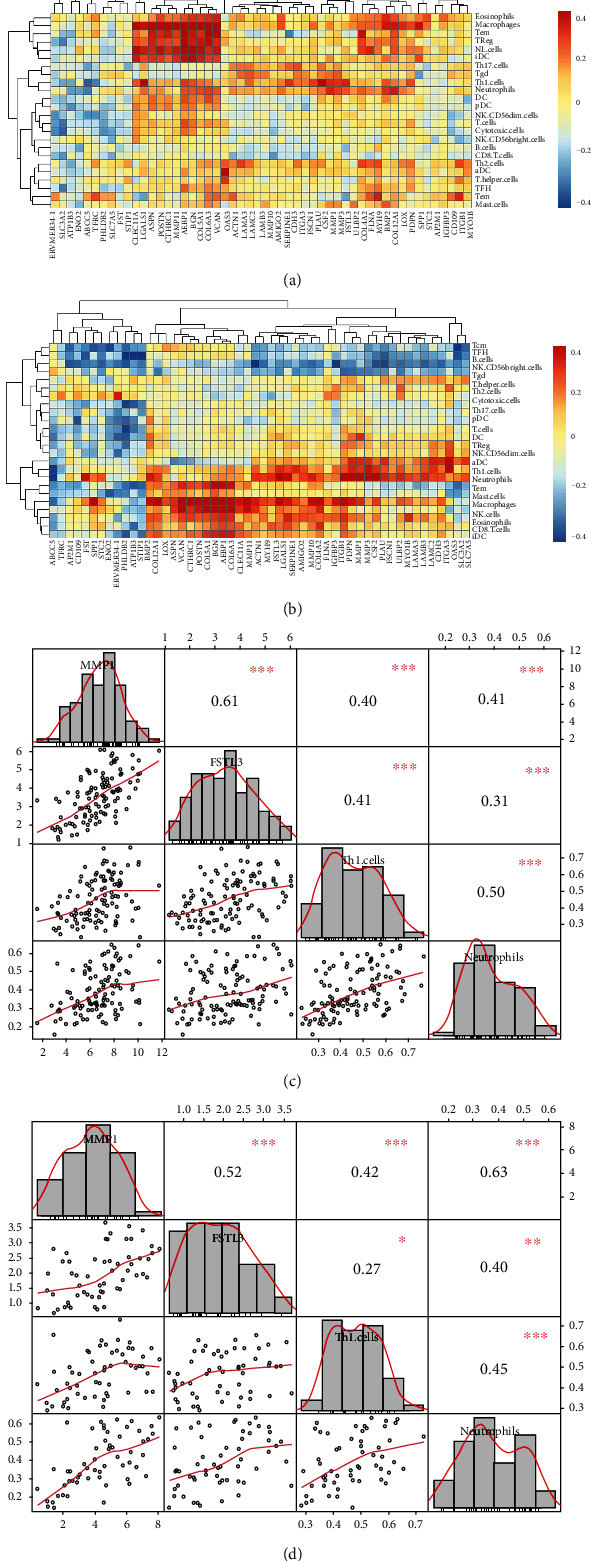
Figure 6.

Correlations between differentially expressed, worse-survival-related SMPs, and the infiltrations of immune cells: (a) correlations in the TCGA dataset; (b) correlations in GSE127165; (c) correlations among MMP1, FSTL3, Th1 cells, and neutrophils in the TCGA dataset; (d) correlations among MMP1, FSTL3, Th1 cells, and neutrophils in GSE127165.
