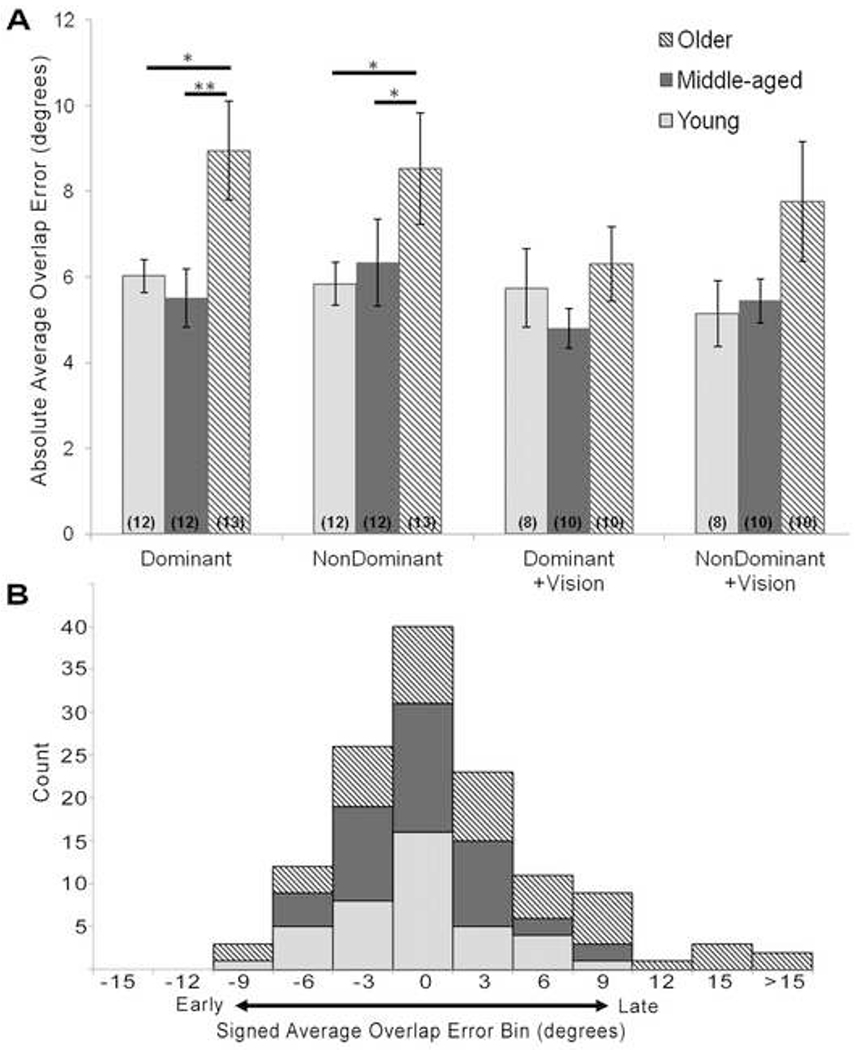
Fig. 3.

(A) Average absolute error, in degrees about the MCP, made on the overlap task for the dominant and non-dominant hands, with and without vision. The older age group performed significantly worse than the young and middle-aged groups for both the dominant and non-dominant hands without vision. However, no difference existed between the age groups when participants were permitted visual feedback of their hand. Numbers in parentheses indicate the number of participants tested for each condition. Error bars are standard error. * = p<0.05. ** = p<0.01. (B) Histogram distribution of signed average errors made on the overlap task
