
Fig. 5.
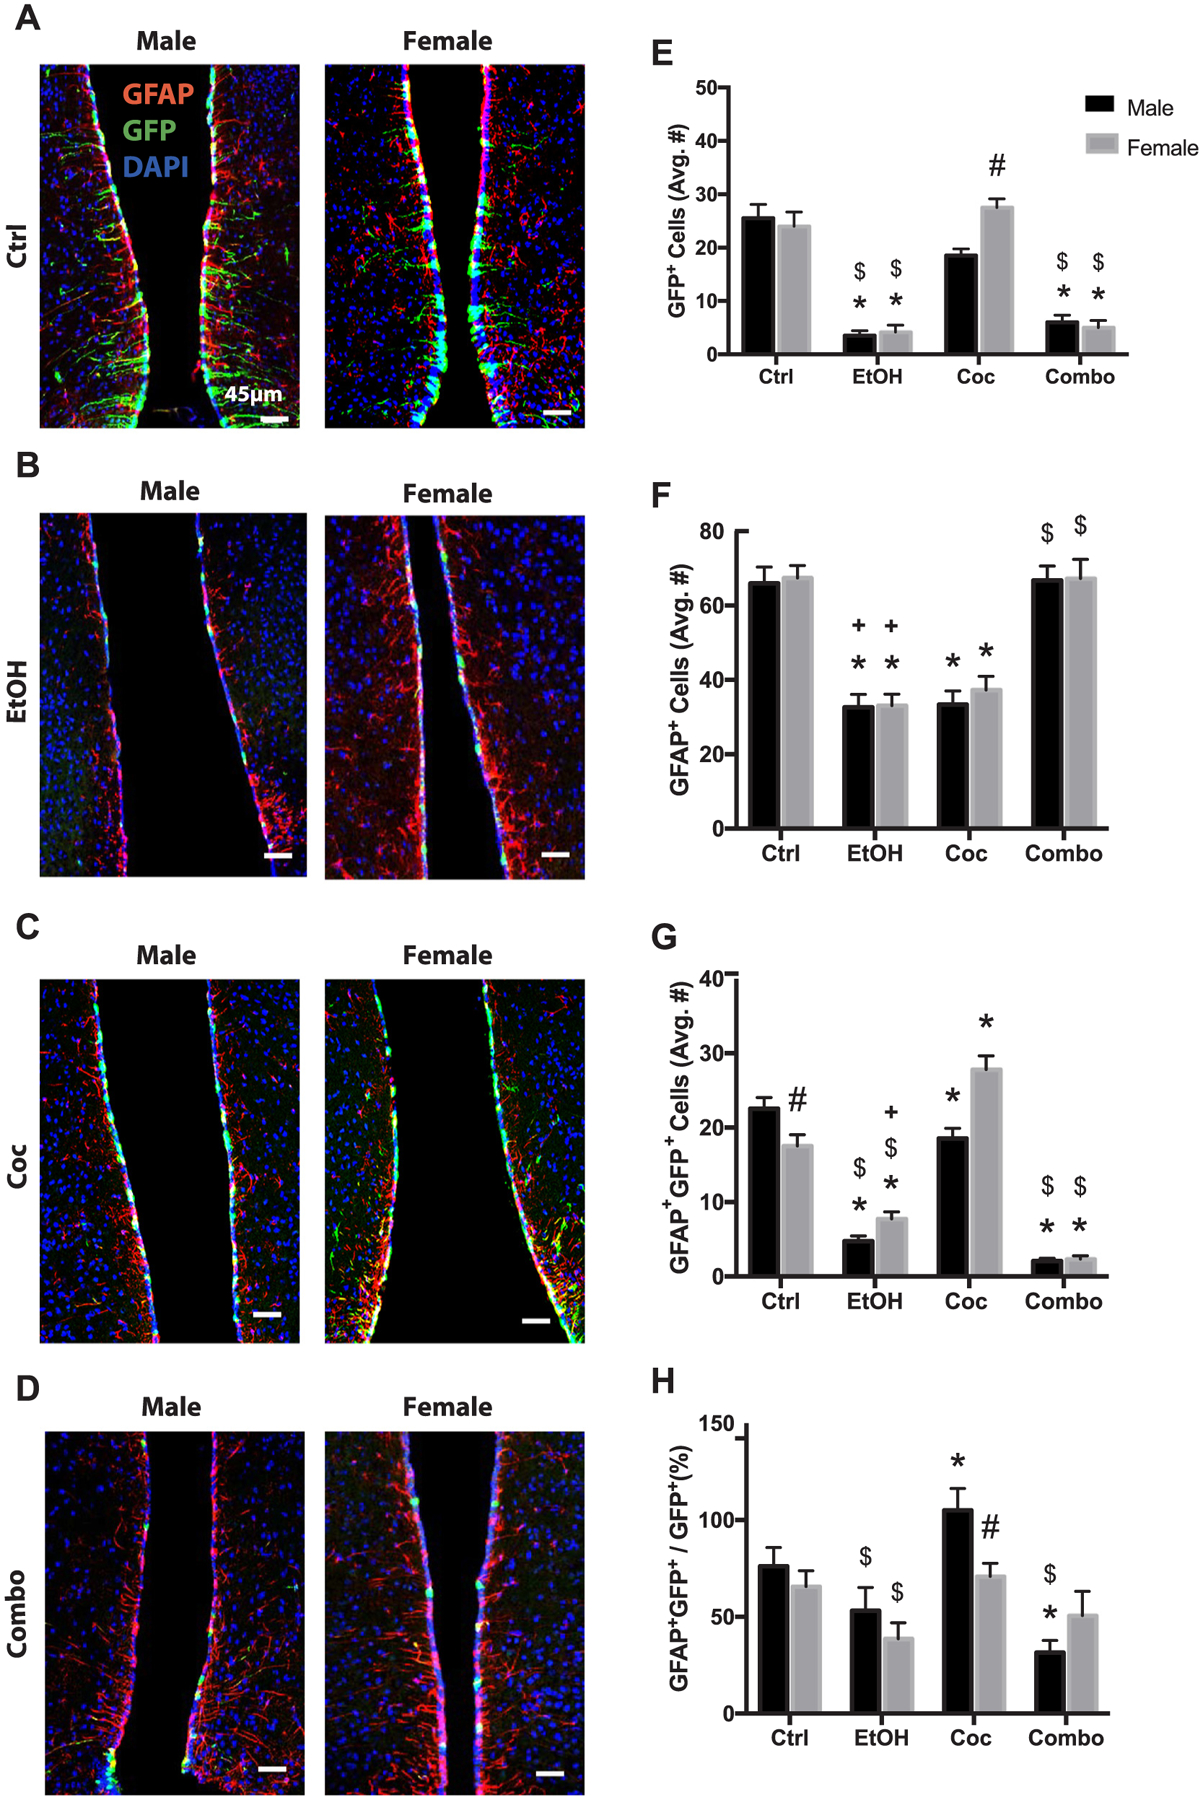
Neural stem cell and astrogliogenesis in the tanycyte layer (TL). (A–D) Representative brain images of control (Ctrl), ethanol (EtOH), cocaine (Coc), and combination (Combo) treated mice, respectively, stained with stem cell marker (GFP green), astrocyte marker (GFAP red), and merged with nuclear maker DAPI (Bregma 0.5 through 1.08). (E–H) Quantification of GFP+, GFAP+, GFAP+GFP+, and the percentage of GFAP+GFP+ over total GFP+ cells, in the SGZ. Values are shown as mean ± SEM, *p < 0.05 compared to control, #p < 0.05 compared to other sex in the same group, $p < 0.05 compared to cocaine group, +p < 0.05 compared to combination group, n = 3 mice per sex per group. Scale bars, 45 μm.