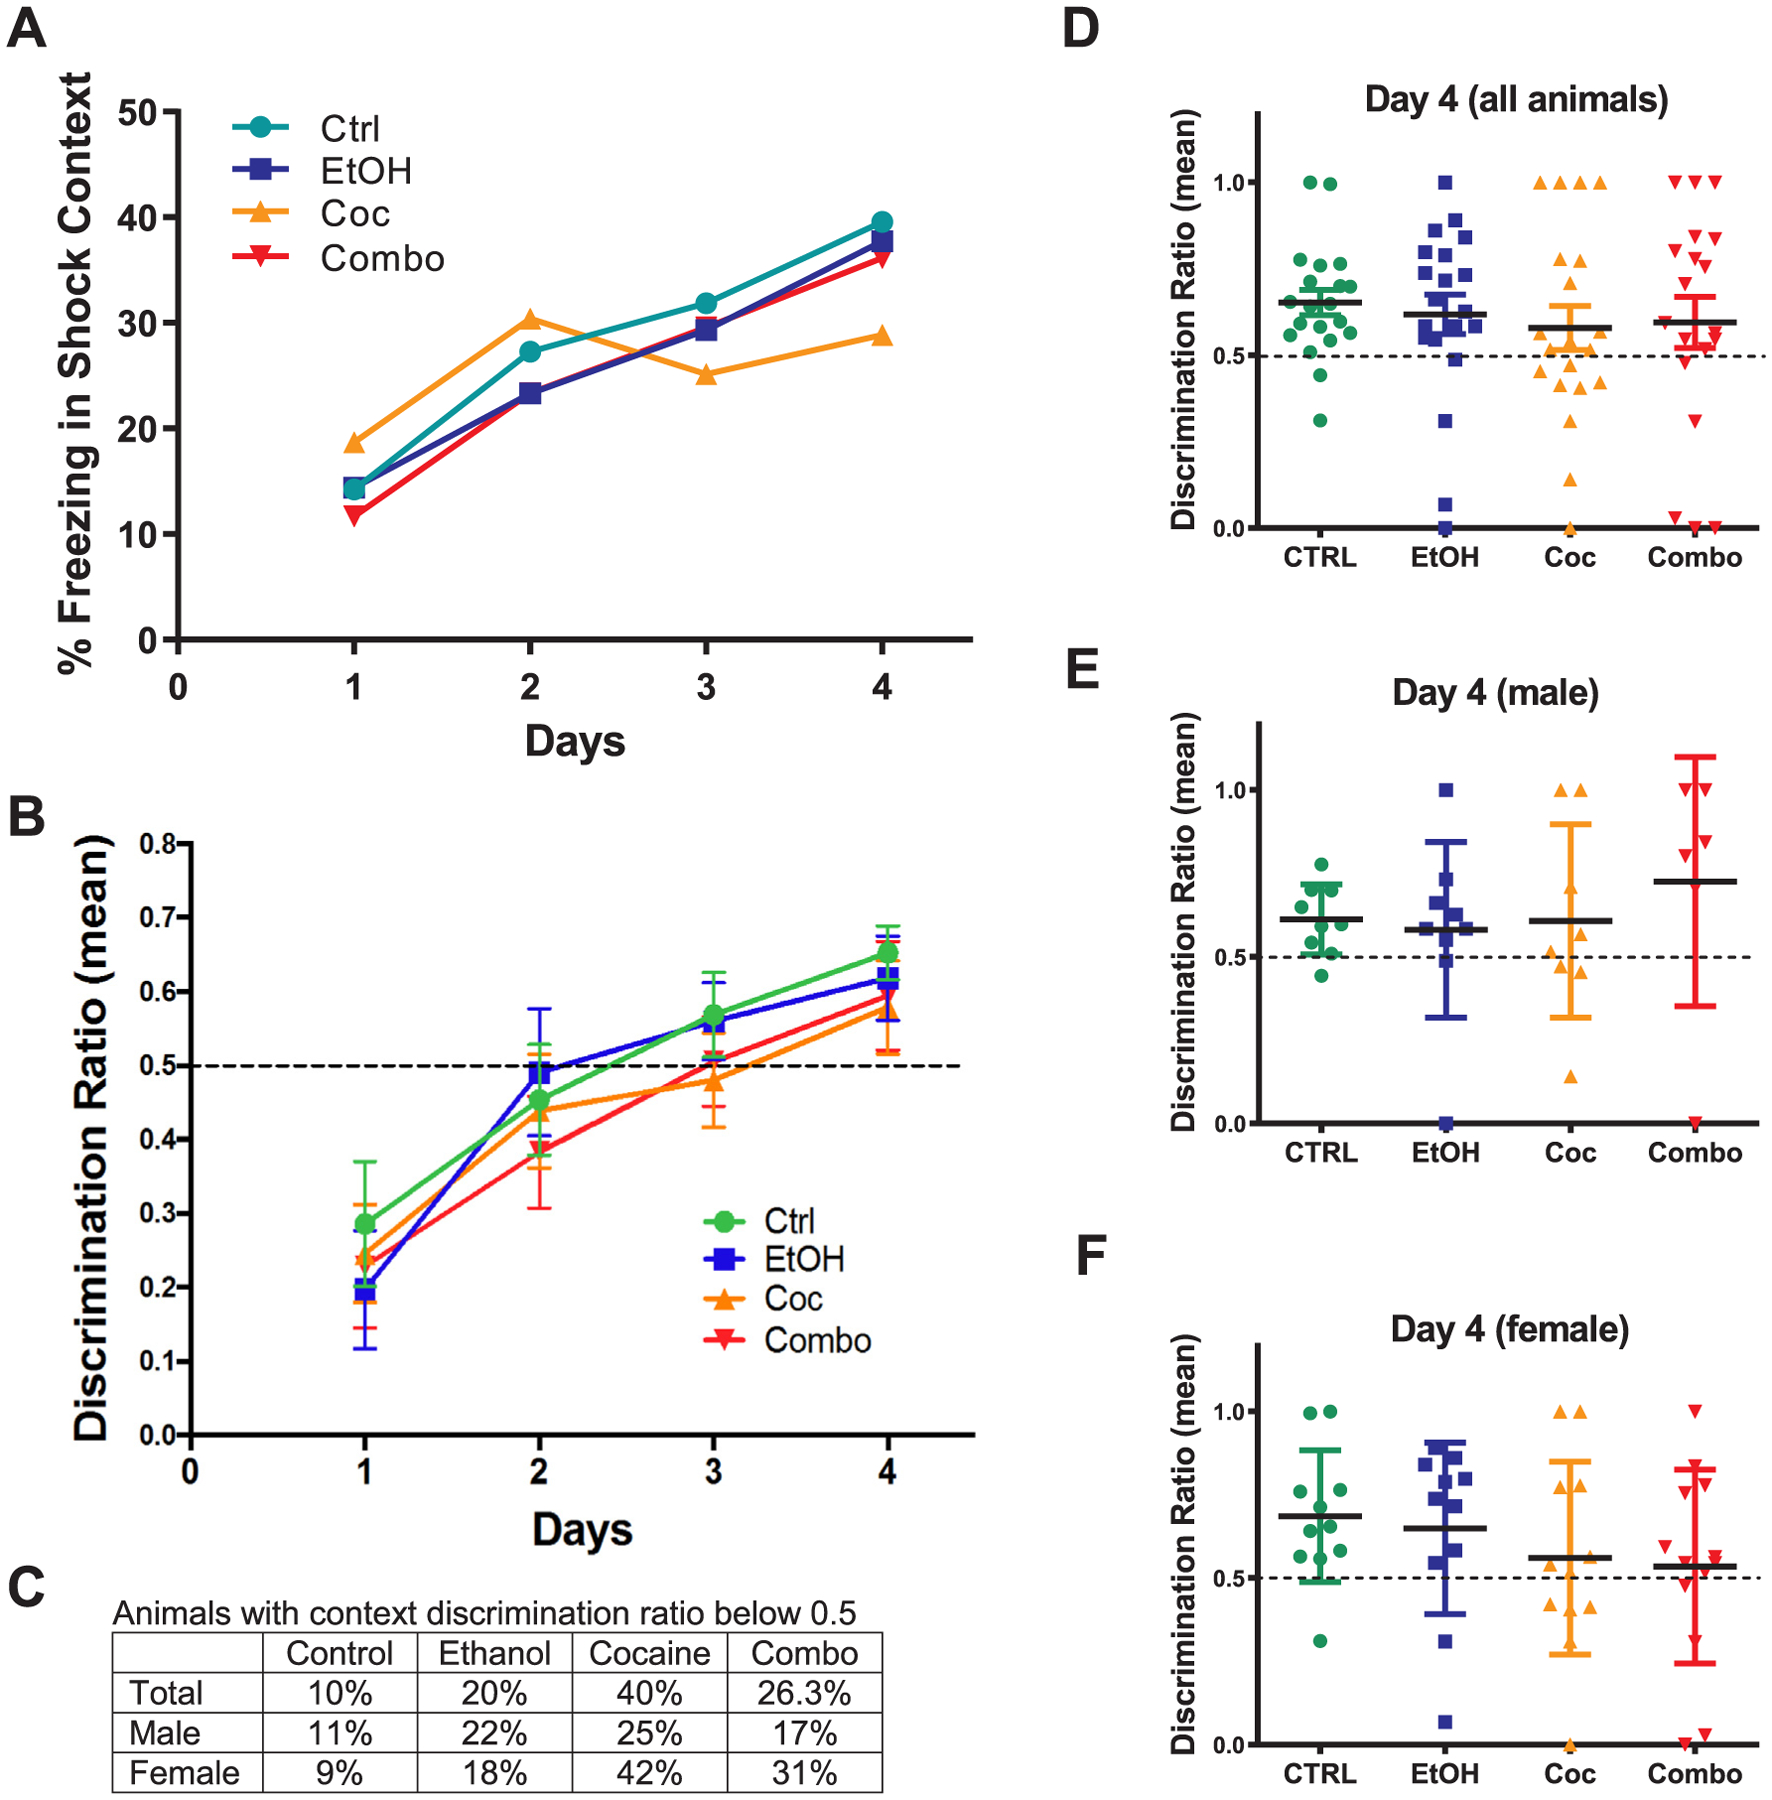
Fig. 6.

Context fear discrimination learning paradigm. (A, B) Analysis of percent freezing (b) and discrimination ratio (c) for each treatment group from day 1–4. (C) Chart comparing the percentage of male and female in each treatment group with a discrimination ratio below 0.5. (D–F) plots of the discrimination ratio for individual animal in each group on day 4. Control (Ctrl) n = 20, ethanol (EtOH) n = 20, cocaine (Coc) n = 20, and combination (Combo) n = 19. Values are shown as mean ± SEM.
