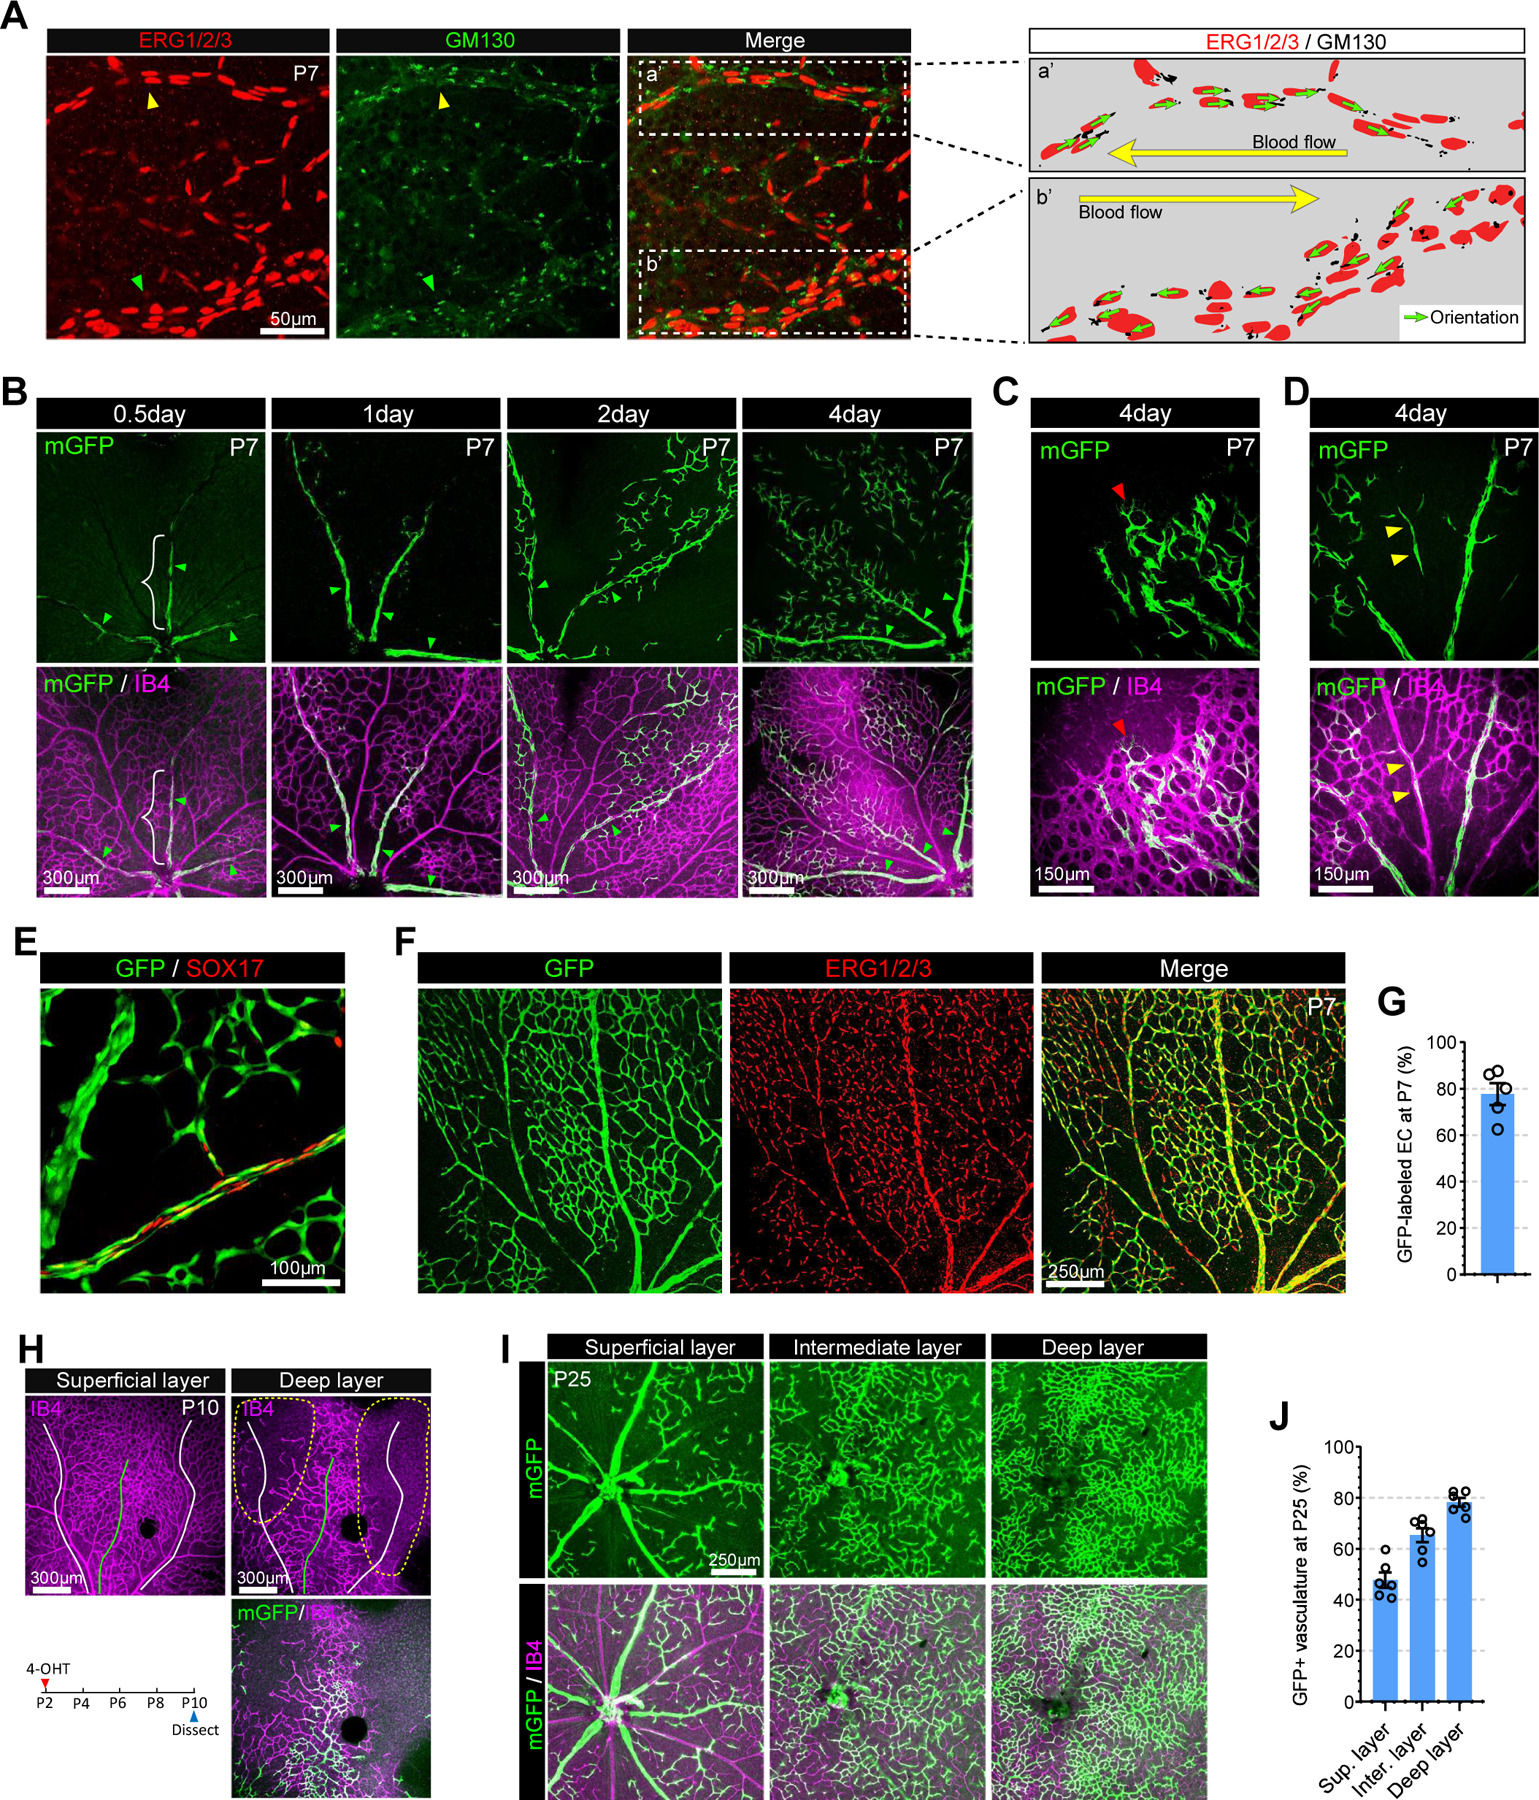
Figure 1. VECs differentiate into tip, capillary and arterial ECs in the retinal vasculature.

A. Confocal images showing ERG1/2/3 (red, EC nucleus marker) and GM130 (green, golgi marker) immunostaining in P7 retinal vasculature. Right panel represents endothelial nucleus and golgi in the area with white dotted rectangle (a’ : artery and b’ : vein). Note that the orientation (green arrows) of EC polarization is against blood flow (yellow arrow). B. Tracing of mGFP-expressing VECs (green) in the retinal vasculature (Isolectin B4, purple) of VECmReporter mice. Note that mGFP expressing VECs are restricted to proximal veins (white brace) at 12hr after induction. These cells are incorporated into capillaries (2days after induction) and arteries (4 days after induction). C. Immunostaining for Isolectin B4 (purple) at 4 days after induction showing mGFP-positive ECs (green) in the vascular front of P7 retinal vasculature. Red arrowhead indicates mGFP-positive TipEC D. Immunostaining for Isolectin B4 (purple) at 4 days after induction showing mGFP-positive ECs (green) in a retinal artery (yellow arrowheads). E. Confocal images showing GFP (green) and SOX17 (red) immunostaining in P7 retinal vasculature of VECiDreReporter mice when 4-OHT was administrated at P0, P1 and P2. F. Confocal images showing GFP (green) and ERG1/2/3 (red) immunostaining in P7 retinal vasculature of VECiDreReporter mice when 4-OHT was administrated at P0, P1 and P2. G. Quantification of GFP+ ECs in P7 retinal vasculature of VECiDreReporter mice. (n=5) H. P10 retinal whole mount Immunostaining of VECmReporter mice for Isolectin B4 (purple) and mGFP (green) at 8 days after induction. Upper panel shows vasculature in superficial (left) and deep layer (right). Lower panel shows 4-OHT administration strategy (left) and mGFP expression (green) in the vasculature (Isolectin B4, purple) of deep layer (right). Note that angiogenic sprouts are mainly located under a vein (green line) while the yellow dotted area under arteries and capillaries (white lines) is avascular. I. P25 retinal whole mount Immunostaining of VECmReporter mice showing vasculature (purple) and mGFP+ (green) ECs in superficial, intermediate and deep retinal layers after 4-OHT administration at P2.5. J. Quantification of GFP+ ECs in each retinal layer of VECmReporter mice. (n=6)
