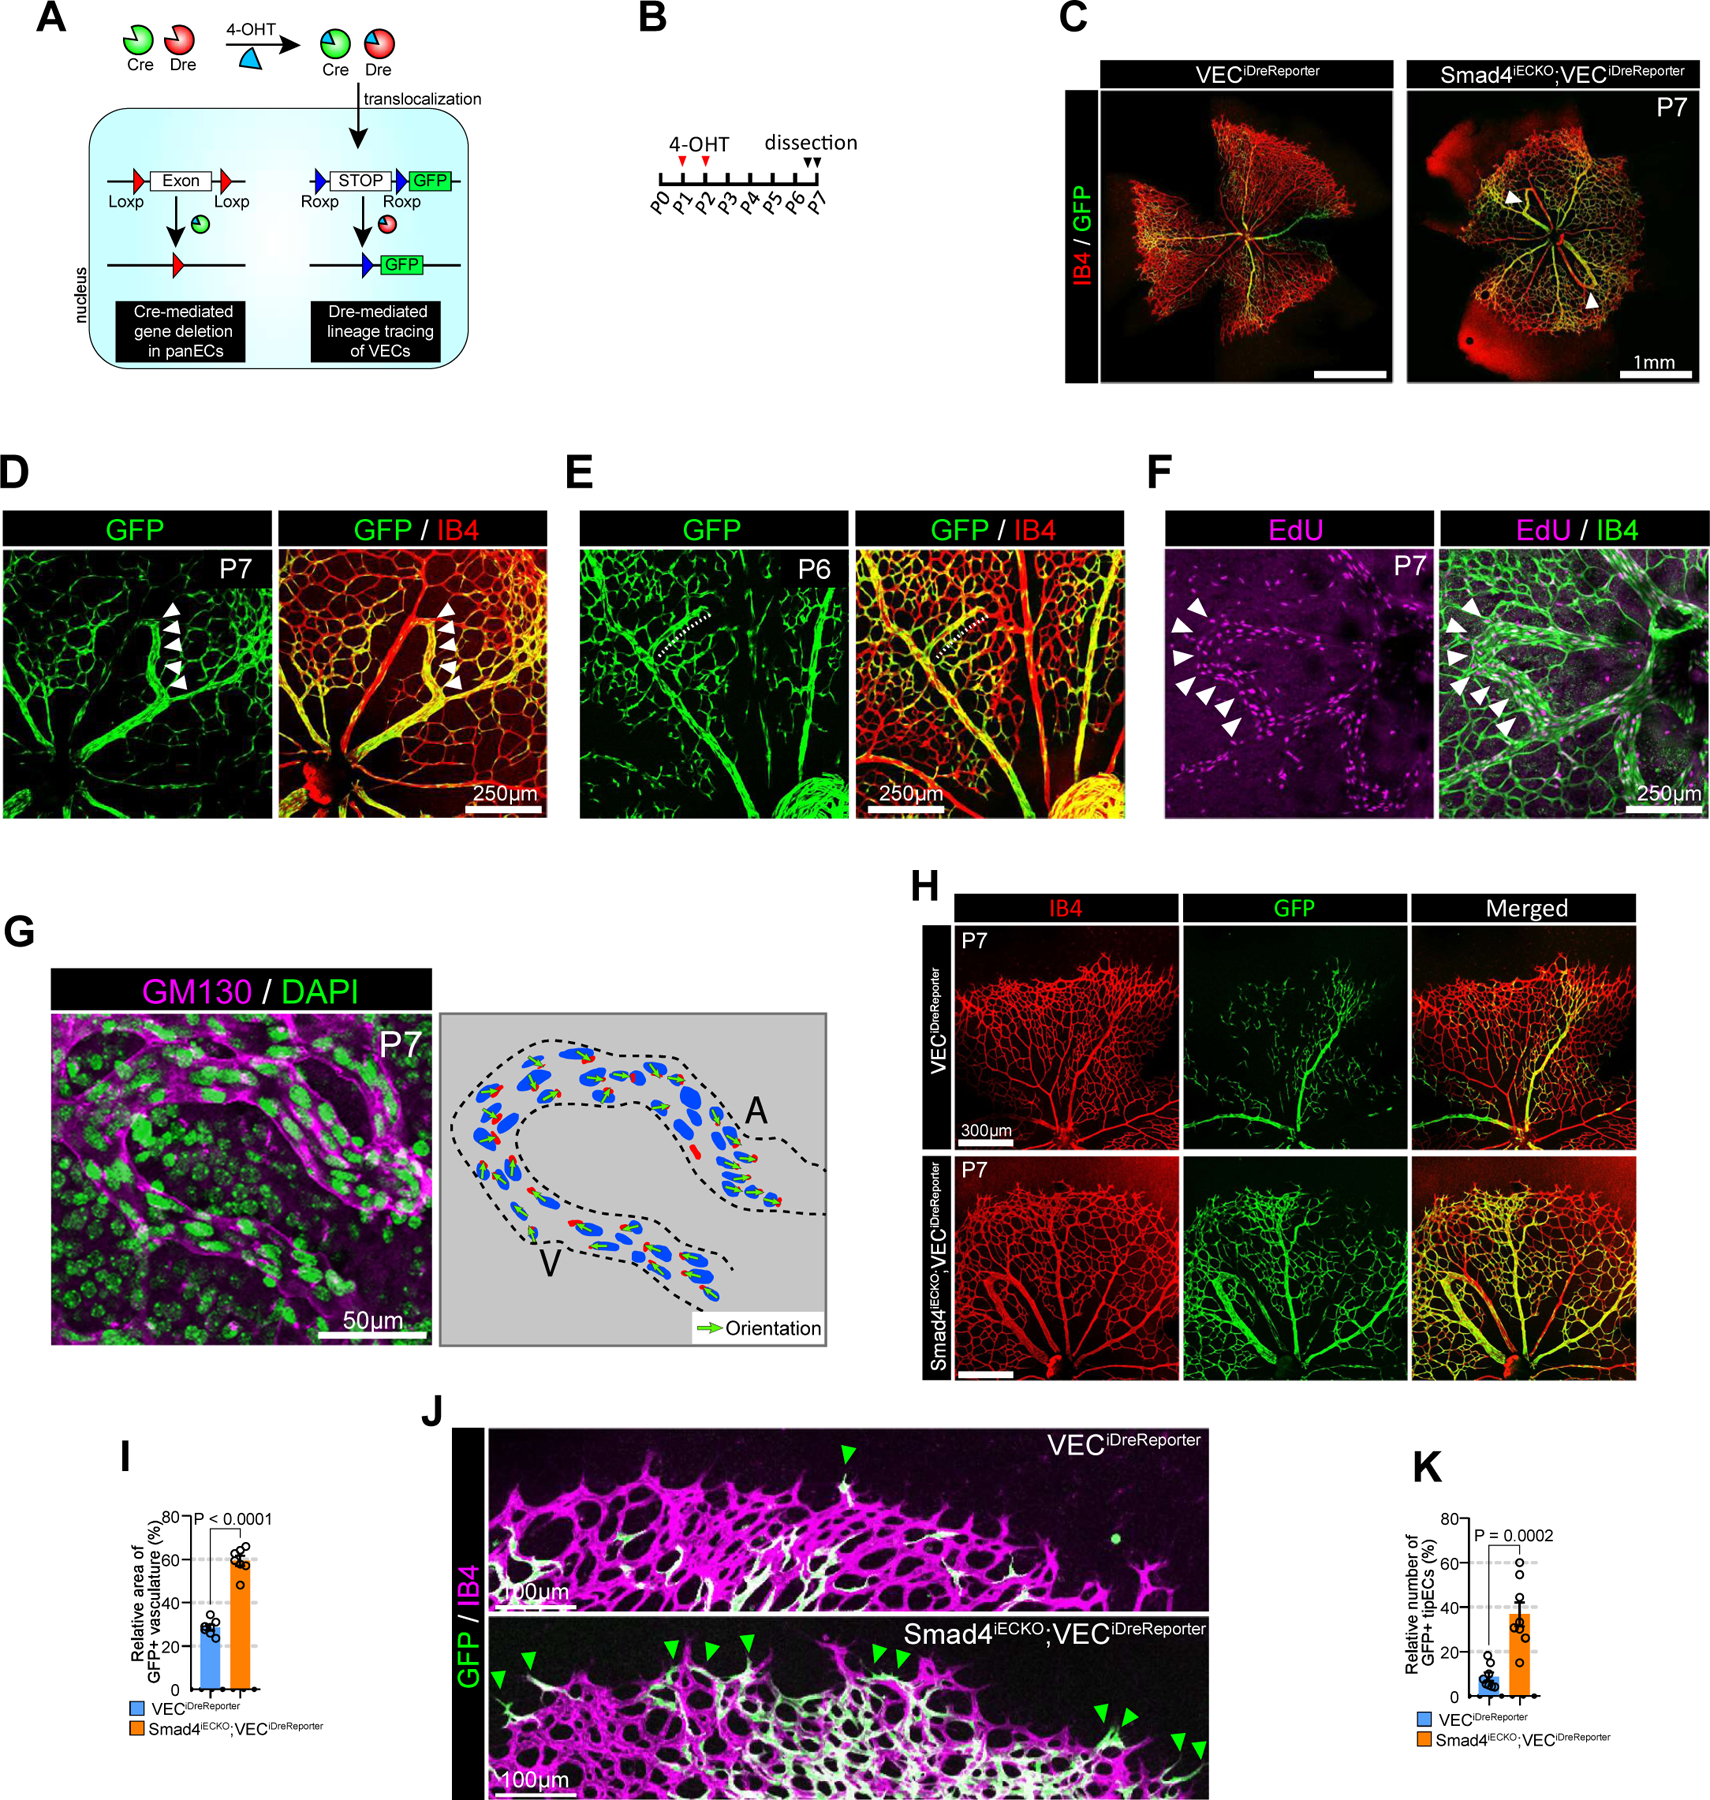
Figure 4. Misdirected migration of VECs results in AV shunt formation.

A. Schematic diagram showing a strategy for generation of Smad4iECKO;VECiDrereporter mice. Smad4 is deleted by inducible panEC specific Cre (Cdh5(PAC)CreERT2) while VECs is labeled with GFP using VEC-specific inducible Dre (Gm5127(BAC)DreERT2). B. Strategy for 4-OHT administration and analysis. C. Representative images showing the vascular phenotype (Isolectin B4 : red and GFP: green, respectively) of Smad4iECKO;VECiDrereporter (right) mice and WT littertmate(left, VECiDrereporter). White arrowheads indicate AVMs. D. Representative images showing the P7 retinal vasculature (Isolectin B4 : red, GFP: green) of Smad4iECKO;VECiDrereporter mice. White arrowheads indicate AV shunt. E. Representative images showing the P6 retinal vasculature (Isolectin B4 : red, GFP: green) of Smad4iECKO;VECiDrereporter mice. Note that vein starts to form abnormal branch (white dotted line) toward the nearby artery and ECs in the sprout are labeled with GFP. F. Confocal images showing EdU and IB4 staining in P7 retinal vasculature of Smad4iECKO mice. Note that ECs in AV shunt are highly proliferative. G. Representative images showing GM130 (cyan) and DAPI (green) immunostaining in P7 retinal vasculature (Isolectin B4 : red, GFP: green) of Smad4iECKO mice. Right panel represents endothelial nucleus and golgi in AV shunt. Note that endothelial golgi orientation in AV shunt is toward artery. H. Representative images showing the P7 retinal vasculature (Isolectin B4 : red, GFP: green) of Smad4iECKO;VECiDrereporter mice and WT littermate at low magnification. I. Quantification of GFP+ area in the P7 retinal vasculature of VECiDrereporter (blue) and Smad4iECKO;VECiDrereporter (orange) mice. (n=7, unpaired two-samples t-test) J. Representative images showing the vascular front area of P7 Smad4iECKO;VECiDrereporter mice (bottom) and WT littermate (top). (Isolectin B4 : purple, GFP: green). Green arrowheads indicate GFP+ TipECs. K. Quantification of GFP+ TipECs in the P7 retinal vasculature of VECiDrereporter (blue) and Smad4iECKO;VECiDrereporter (orange) mice. (n=8, unpaired two-samples t-test)
