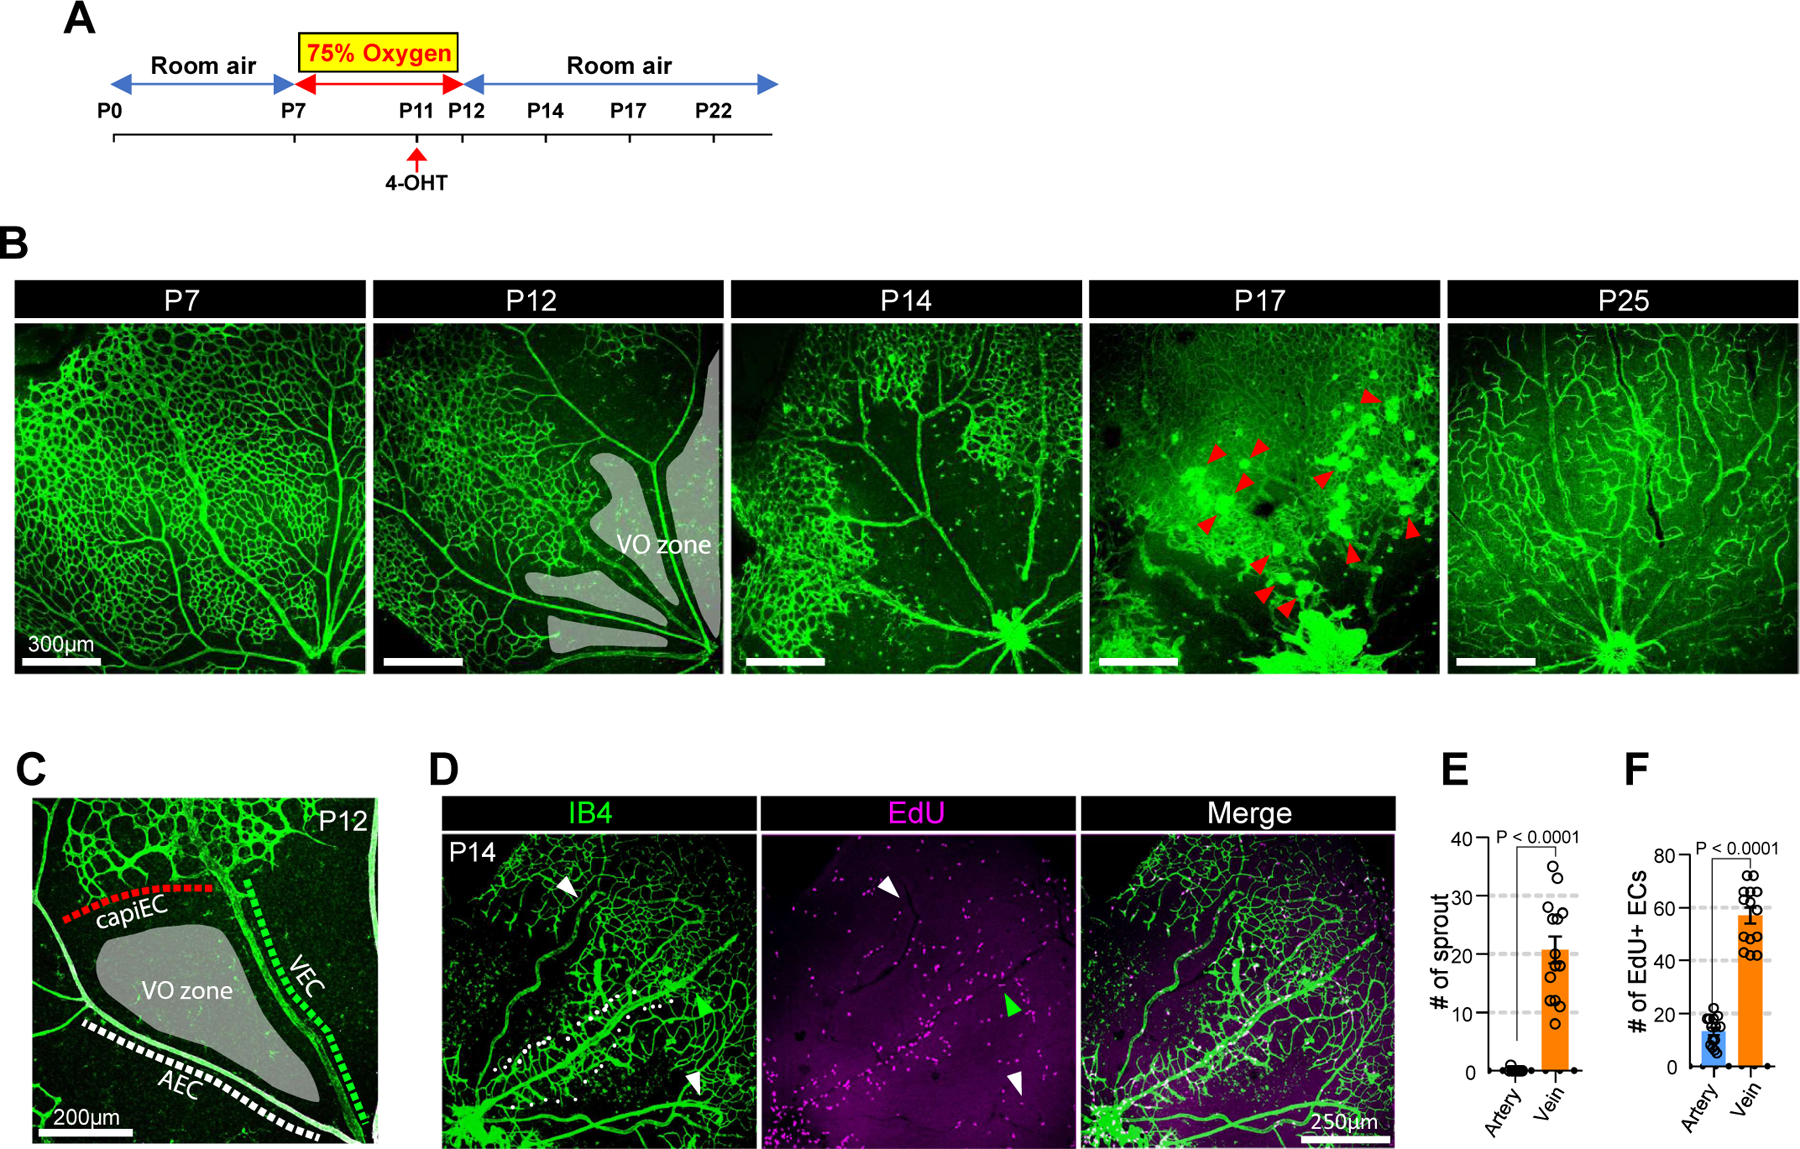
Figure 5. Vein is the primary site for neoangiogenic spout initiation in OIR-induced neovascularization.

A. schematic diagram showing the experimental design of the OIR model. Postnatal pups along with their nursing female were exposed to 75% oxygen from P7 to P12 to induce vaso-obliteration and returned to room air from P12 until further analysis. 4-OHT was injected at P11 to label VECs in VECiDrereporter mice before dissection at indicated time points. B. Time course observation of vasculature (Isolectin B4, green) during OIR at indicated time points (P12, P14, P17 and P22, respectively). At P12, the vasculature forms vaso-obliteration zone (VO zone, gray-colored area). At P14, the vasculature initiates neovascularization. At P17, the vasculature shows strong angiogenic activity and forms neovascular tuft (red arrowheads). At P25, the VO zone is fully recovered. C. Representative image showing the endothelial environment of vaso-obliteration zone. (VO zone) Note that VO zone is surrounded by three different endothelial subtypes including AEC, VEC and CapiEC. D. Representative images showing EdU staining (purple) in the P14 vasculature (Isolectin B4, green) of OIR model. Note that only vein (green arrowhead) initiates angiogenic sprouting (white dots), but not artery (white arrowheads). E. Quantification of angiogenic sprouts from artery (blue) and vein (orange) at P14 OIR retina. (n=14, unpaired two-samples t-test) F. Quantification of Edu-positive ECs in artery (blue) and vein (orange) at P14 OIR retina. (n=14, unpaired two-samples t-test)
