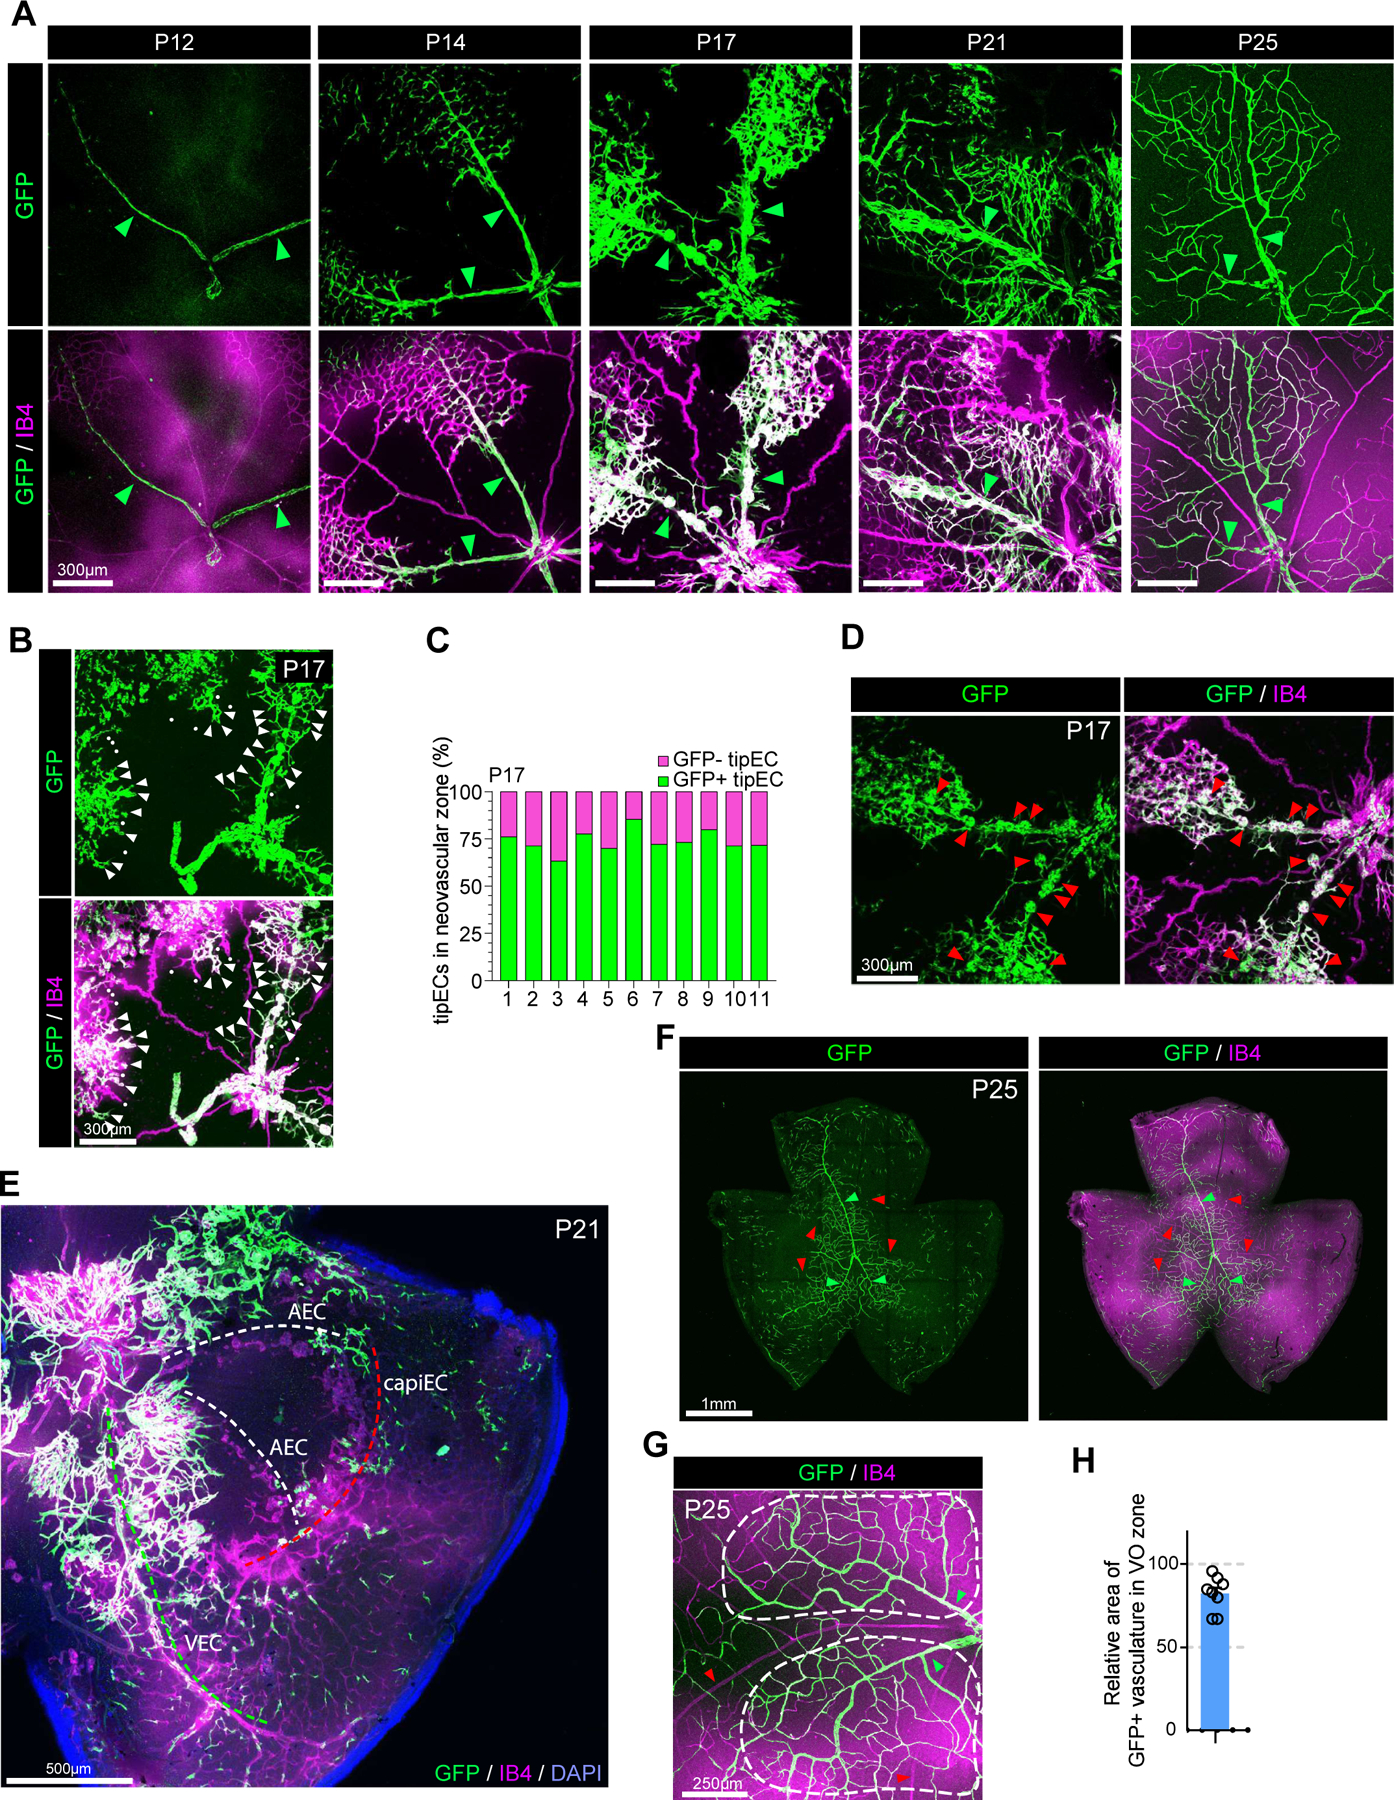
Figure 6. VEC is the primary source of ECs in OIR-induced neovascularization.

A. Time course observation of the vasculature (Isolectin B4, purple) and GFP+ VECs (green) in VECiDrereporter mice during OIR at indicated time points (P12, P14, P17, P21 and P25, respectively). Green arrowheads indicate veins. At P12, only veins express GFP showing VEC specific labeling in VECiDrereporter mice. At P14, GFP+ VECs start migration from veins. At P17, veins, but not arteries, initiate angiogenic sprouting. At P21, the majority of ECs in VO zone of P21 retinal vasculature are GFP+. At p25, the VO zone is completely recovered by GFP+ ECs showing that they are originated from VECs. B. Representative images showing GFP+ TipECs in P17 retinal vasculature of VECiDrereporter mice. (white arrowheads : GFP-positive TipEC, white dots: GFP-negative TipECs) C. Quantification of relative number of GFP+ TipECs versus GFP- TipECs in the neovascular zone of VECiDrereporter mice (P17). X-axis shows individual sample (n=11). D. Representative images showing neovascular tufts (red arrowheads) and GFP expression in P17 retinal vasculature of VECiDrereporter mice. Note that all neovascular tufts are GFP+ showing ECs in the tuft are originated from VECs. E. Representative images showing vasculature in P21 OIR of VECiDrereporter mice (DAPI: blue, GFP: green, Isolectin B4 : purple) Note that the VO zone around vein (green dotted line) is recovered by neovascularization, but not artery (white dotted line) and capillary (red dotted line). F. Representative images showing the vasculature (Isolectin B4 : purple) and GFP-expressing ECs (green) in P25 OIR of VECiDrereporter mice. Note that the majority of VO zone is recovered by GFP+ ECs. Red and green arrowheads indicate arteries and veins, respectively. G. Representative images showing the VO zone (the area in white dotted lines) in P25 OIR of VECiDrereporter mice (Isolectin B4 : purple, GFP: green). Red and green arrowheads indicate arteries and veins, respectively. H. Quantification of GFP+ area in the vasculature of VO zone in P25 OIR. (n=8)
