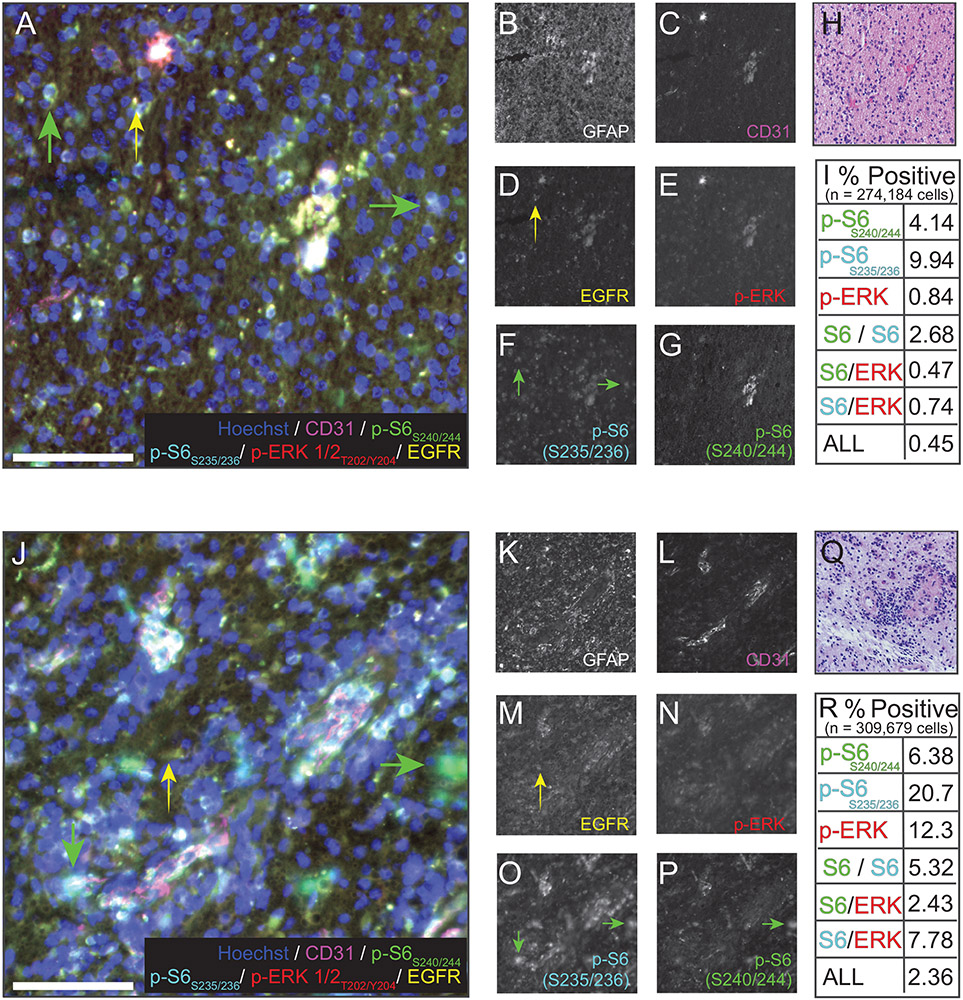
FIGURE 1.
Cyclic immunofluorescence imaging and quantification correlate with sequencing data. Representative 40× immunofluorescence images (stitched fields) of seven-parameter cyclic immunofluorescence on first (A-I) and second (J-R) tumor resections. A and I show six-parameter images of nuclei (Hoechst, blue), CD31 (magenta), p-S6S240/244 (green), pS6S235/236 (cyan) p-ERK1/2T202/Y204, and EGFR (yellow). B-G and K-P show individual channels as grayscale images. Yellow arrowheads point to cells positive for EGFR, but not a phosphorylated protein. Green arrows point to cells positive for a phosphorylated protein, but not EGFR. Scale bars = 100μm. The histological staining used to identify region of interest is shown in H and Q, respectively. Quantification for phospho-signalingin all the cells in all the fields measured is summarized in panels I and R. Cells identified as singly positive for an individual phosphoprotein, combinations of two phosphoproteins, or positive for all three were found in both resections, but were more abundant in the second (recurrence) resection, consistent with genomic profiling

