
FIGURE 2.
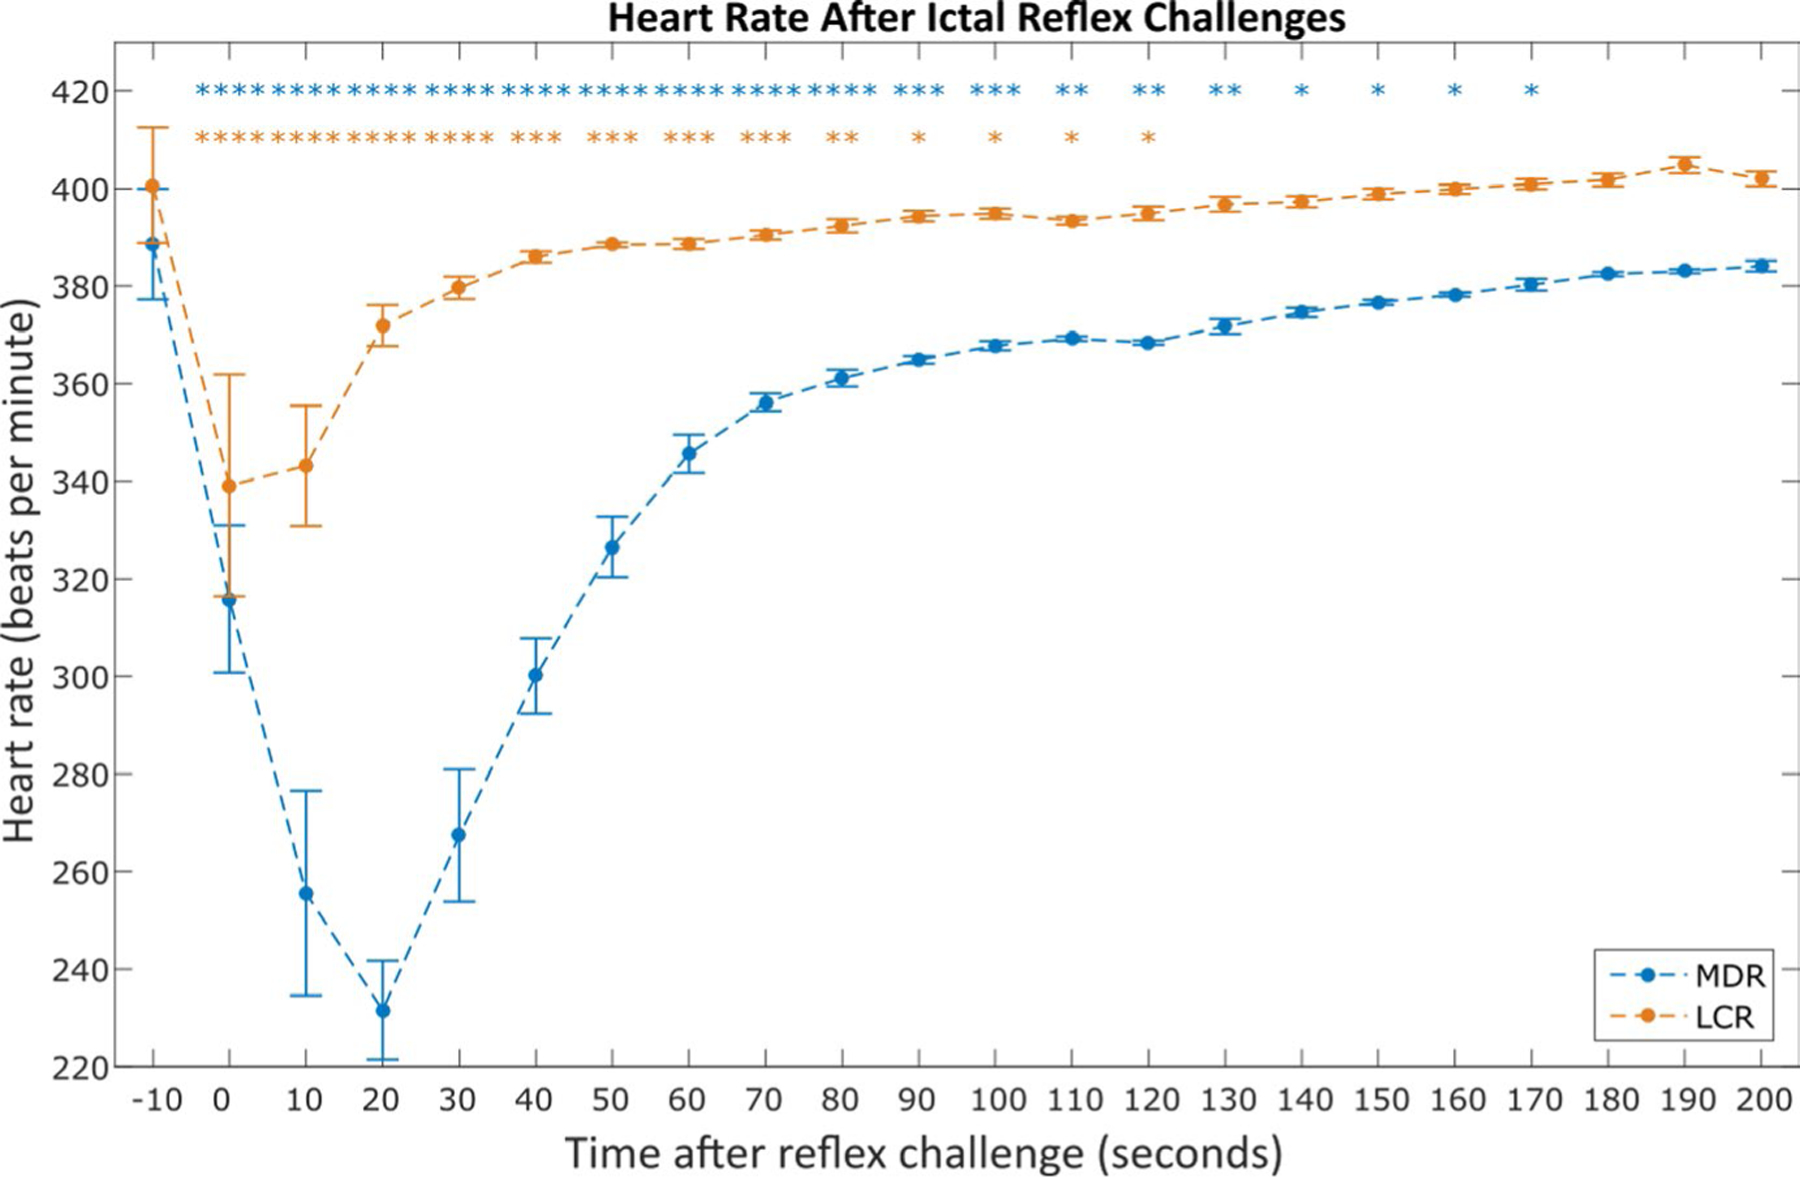
Average heart rate after nonfatal mammalian diving reflex (MDR) and laryngeal chemoreflex (LCR) challenges during seizures. Each point represents the average heart rate in the 10 s window starting at the time indicated on the x-axis (eg, t = 0 represents data for all 0 ≤ t < 10 s). Asterisks indicate a statistically significant difference between the 10 s window and the pre-challenge amplitude (paired t tests). Data were averaged from the total 32 ictal MDR challenges across 10 animals and 69 ictal LCR challenges across 10 animals that did not result in sudden death. *P < .05; **P < .01; ***P < .001; ****P < .0001