
FIGURE 6.
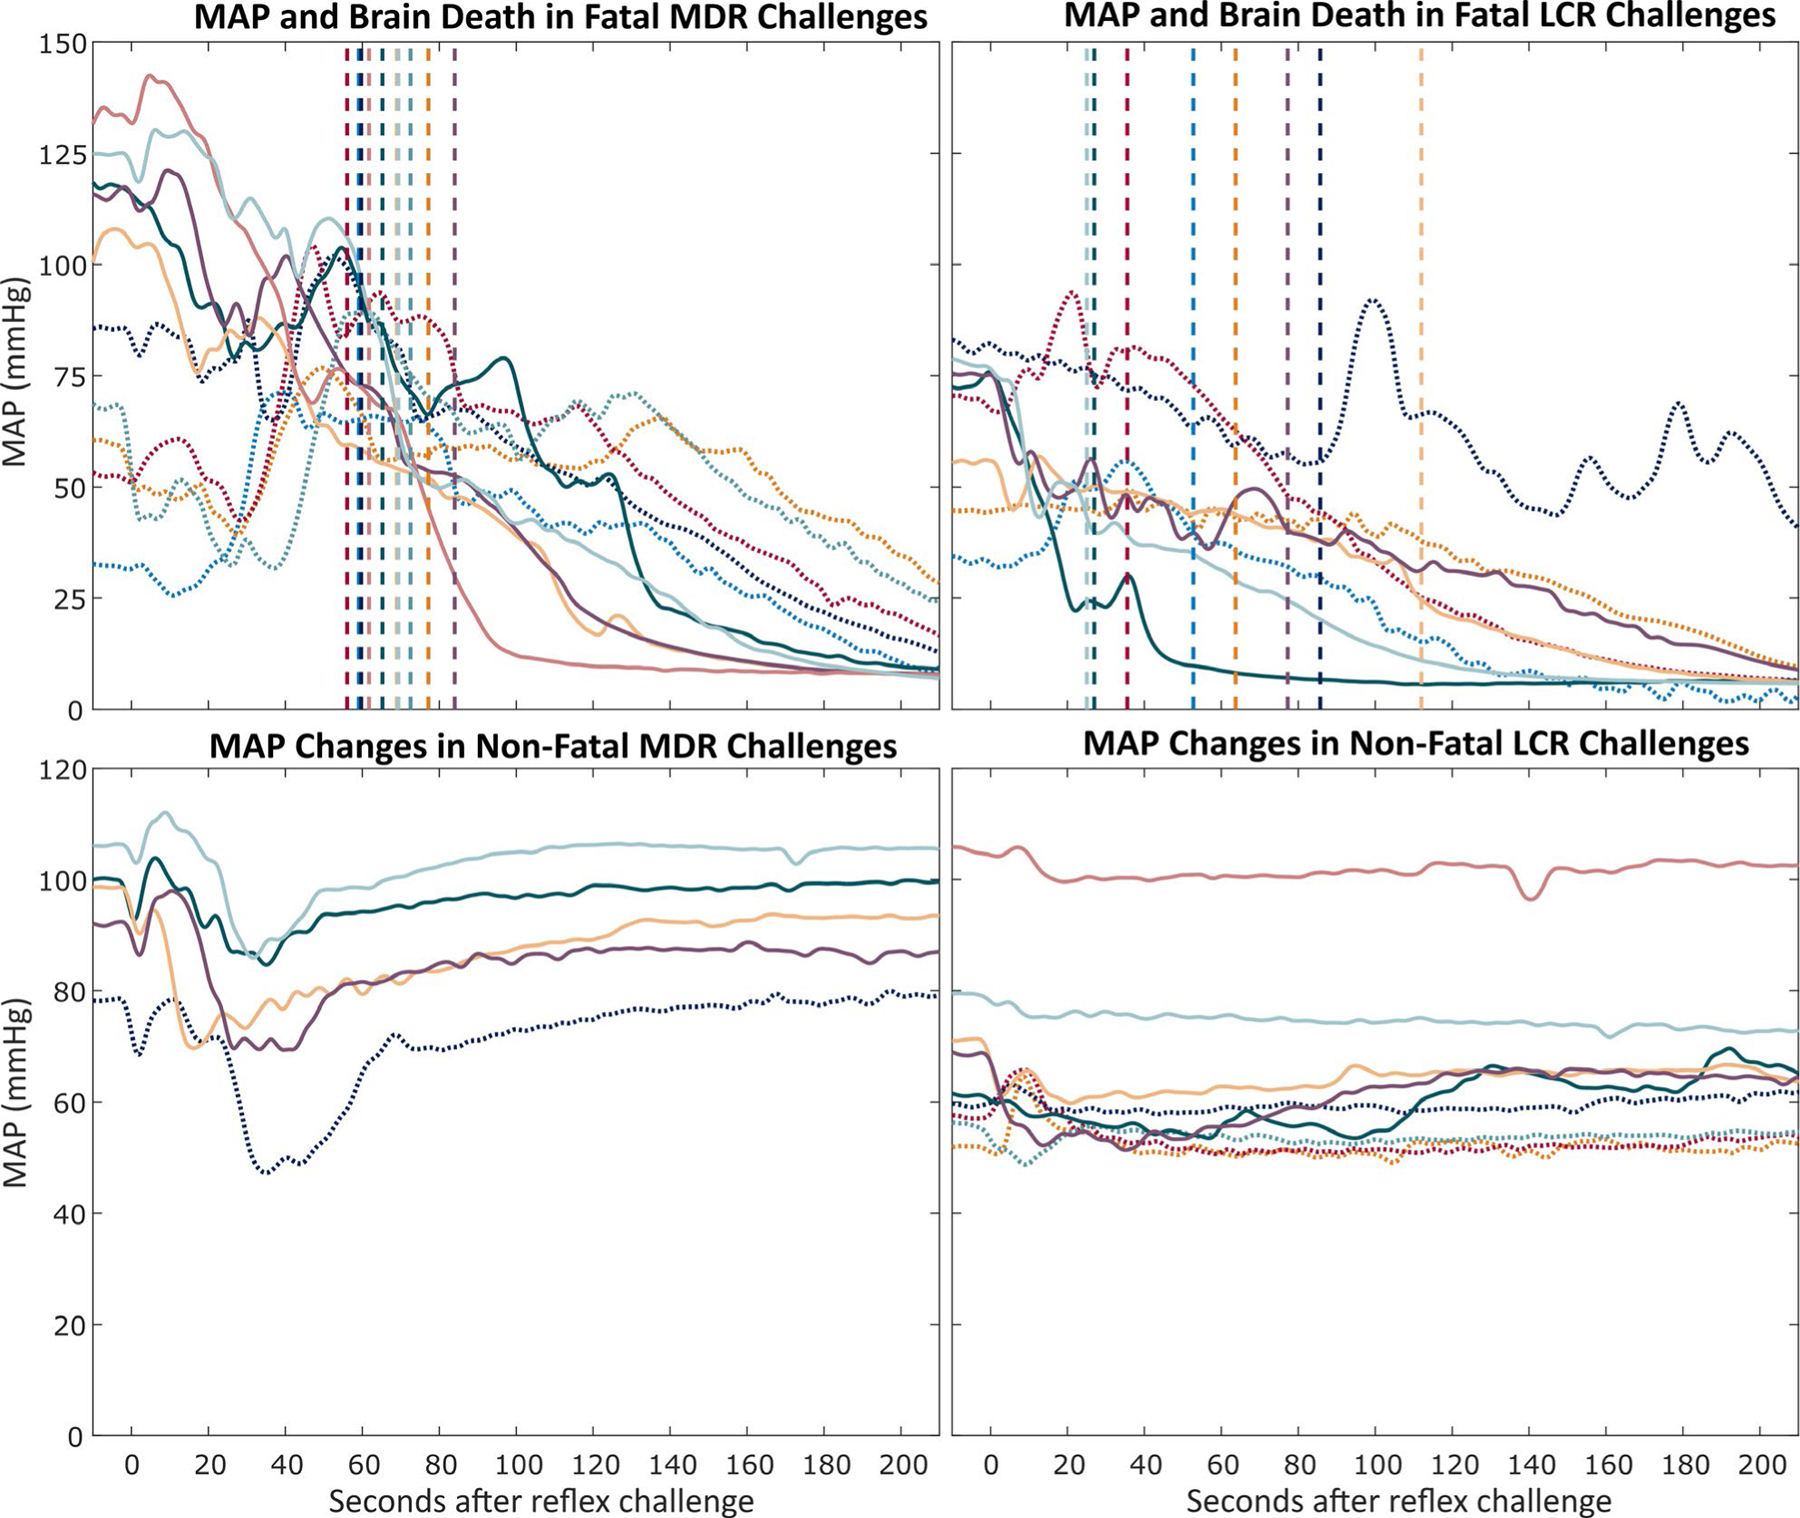
Mean arterial pressure (MAP) during oxygen-conserving reflexes (OCRs) challenges for mammalian diving reflex (MDR) and laryngeal chemoreflex (LCR) challenges. Each color per pair of graphs represents one rat, and colors for the fatal and nonfatal MAP changes from each reflex are consistent between the graphs for that reflex. Solid MAP traces indicate hippocampal kainic acid. Dotted MAP traces indicate systemic kainic acid. The vertical dashed lines indicate the time at which brain death (defined as the root mean square (RMS) amplitude of electrocorticography [ECoG] falling within 4 SDs of the RMS amplitude of the noise floor of the recording channel) occurred. The colors of the vertical lines correspond to the color of the MAP trace for rats in each panel. Top row: MAP changes in fatal reflex challenges during seizures. Traces without a corresponding trace in the nonfatal graph indicate animals that died from the first reflex challenge during seizures. Bottom row: Average MAP changes in nonfatal reflex challenges during seizures. Traces without a corresponding trace in the fatal graph indicate animals that did not die from reflex challenges during seizures. For clarity, confidence intervals are not shown