
FIGURE 7.
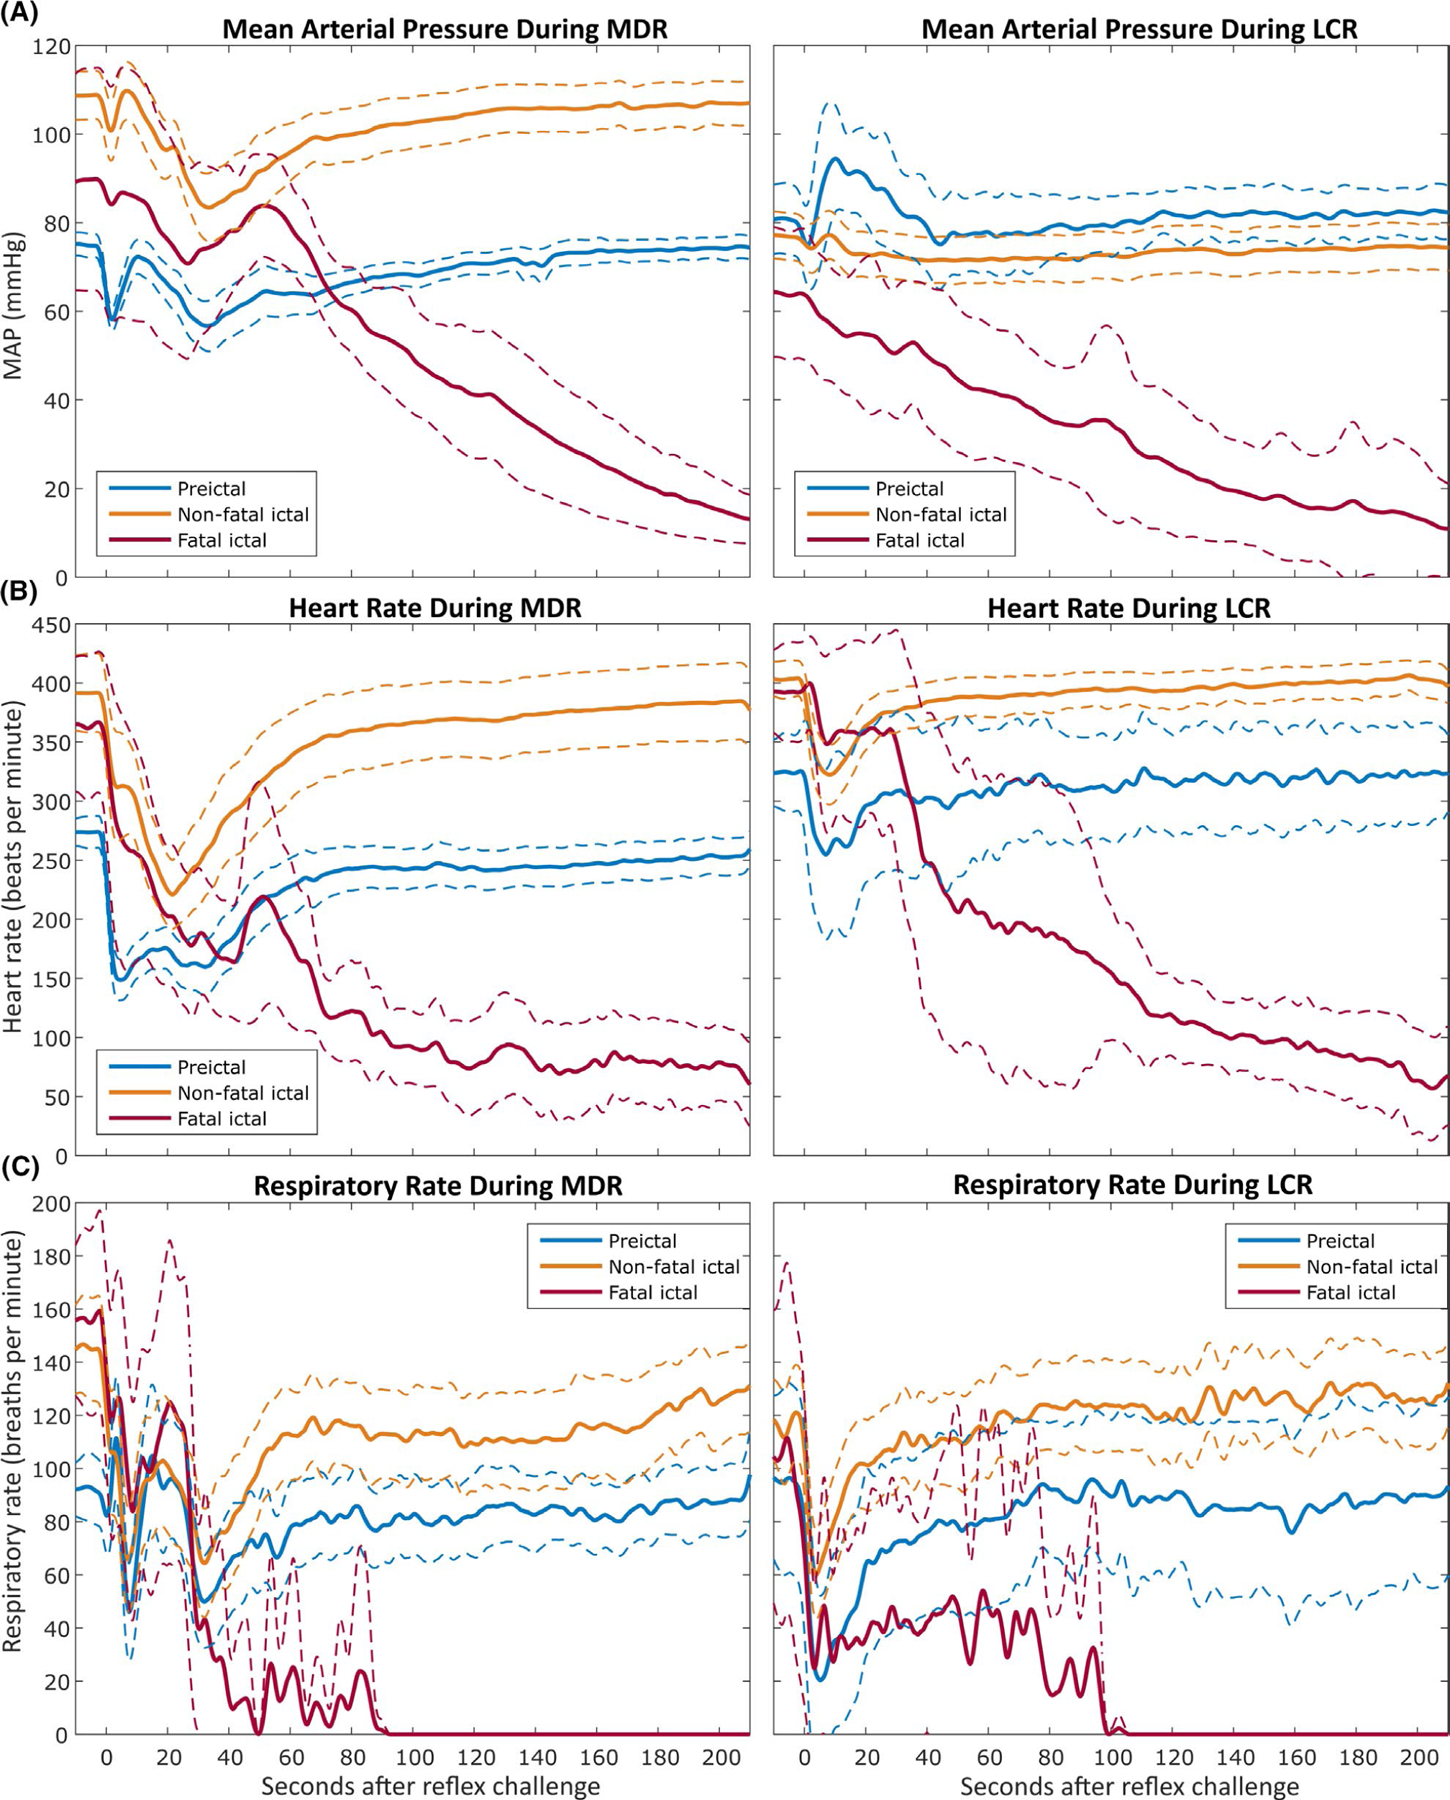
Mean arterial pressure (A), heart rate (B), and respiratory rate (C) measurements during mammalian diving reflex (MDR, left) and laryngeal chemoreflex (LCR, right) challenges. Intrahippocampal and systemic kainic acid data sets have been combined here to permit comparison of reflexes independently from seizure models. The thick lines indicate the average value over time for all trials, with the thinner dashed lines indicating the 95% confidence interval for the values over time across trials. The same legend colors apply to all panels. t = 0 seconds corresponds to the time of reflex challenge initiation. All x-axes are equivalent