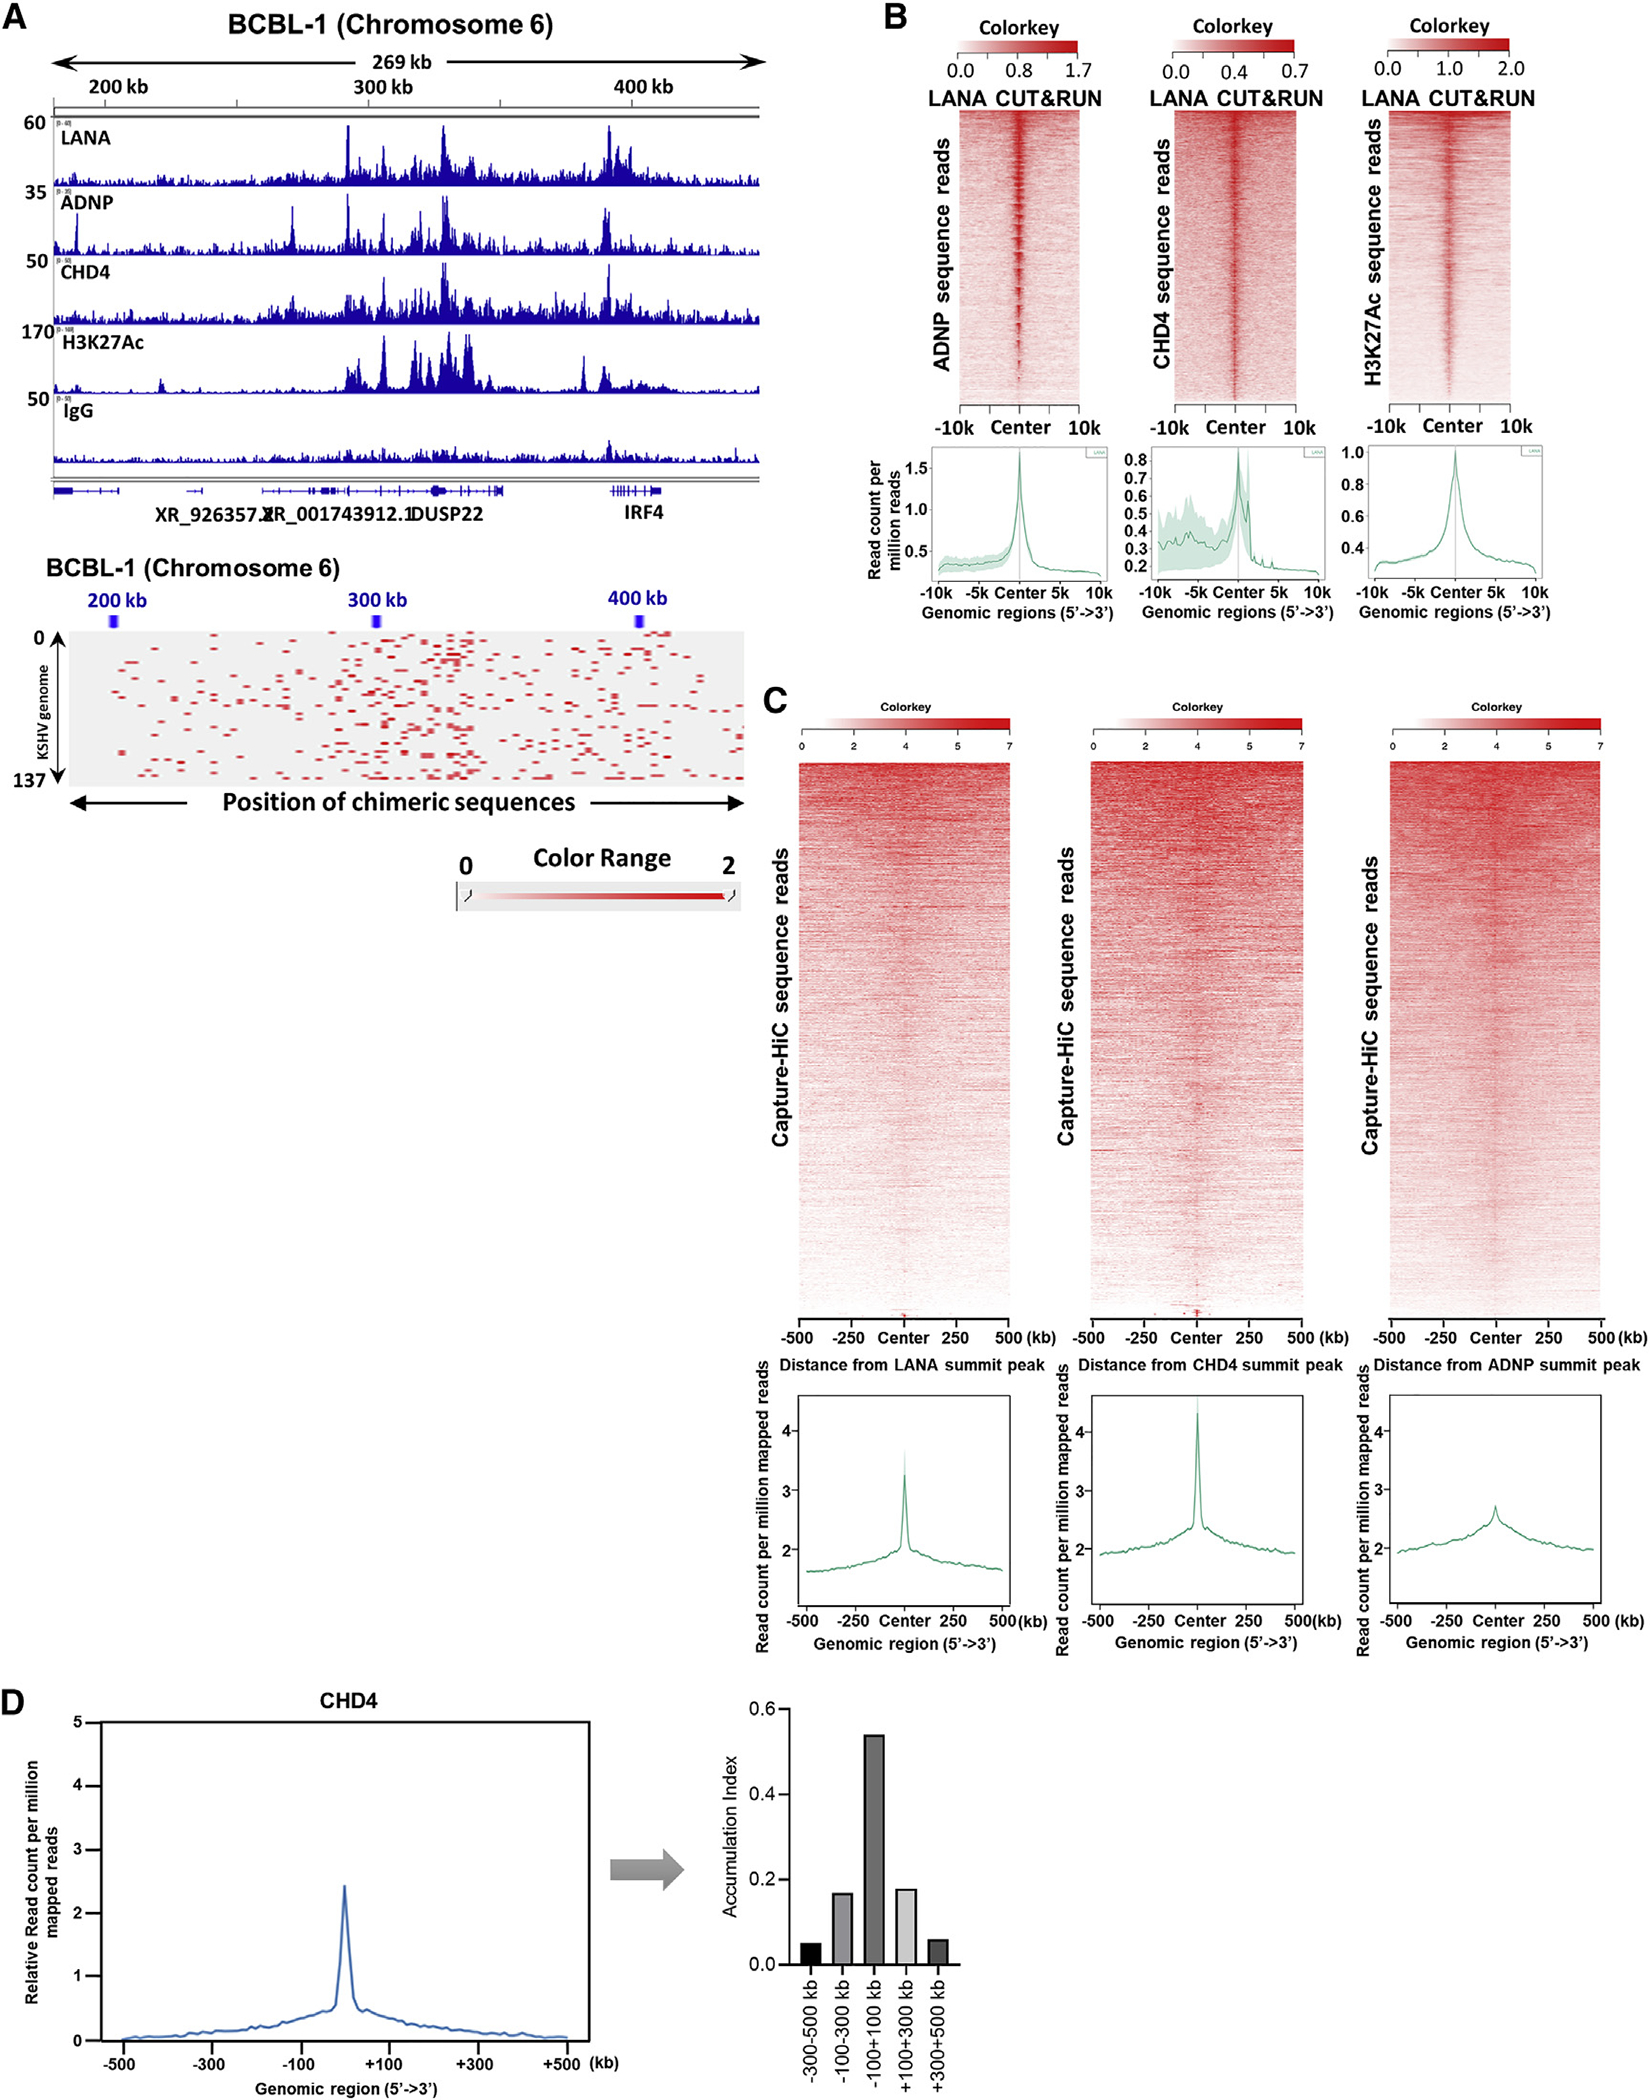
Figure 3. Association of LANA-ADNP-CHD4 complex binding with KSHV episome tethering sites in the human genome.

(A) CUT&RUN was performed for the indicated proteins. Peaks were visualized with Integrative Genomics Viewer (IGV) and one of the major binding sites (IRF4 enhancer region) is shown. The height of the peak (e.g., read depth) and positions on chromosome 6 are denoted on the left-hand side and top of the panels, respectively. The bottom panel shows the mapped chimeric sequence reads between KSHV and host genomic loci visualized with Juicebox.
(B) Heatmap (top) and average profile (bottom) showing correlation of LANA enrichment (by color intensity and region) with ADNP, CHD4, and H3K27Ac occupancies. Average profile plot summarizing the heatmap (bottom). The lighter green shade represents the standard error (SEM) on the average profile plot. Color keys are shown on the each heatmap (top). The x axis shows the distance from LANA summit peaks.
(C) The association between CHi-C chimeric reads pair products and LANA, CHD4, and ADNP CUT&RUN peaks were depicted as heatmap and average profile plot.
(D) The accumulation of CHD4 is displayed as a proportion of area under the curve of the relative average profile. Association between distance from CHD4 summit peak and relative chimeric sequence counts is shown as a bar chart. (A) n = 2 biological replicates for each CUT&RUN, one representative is shown.
