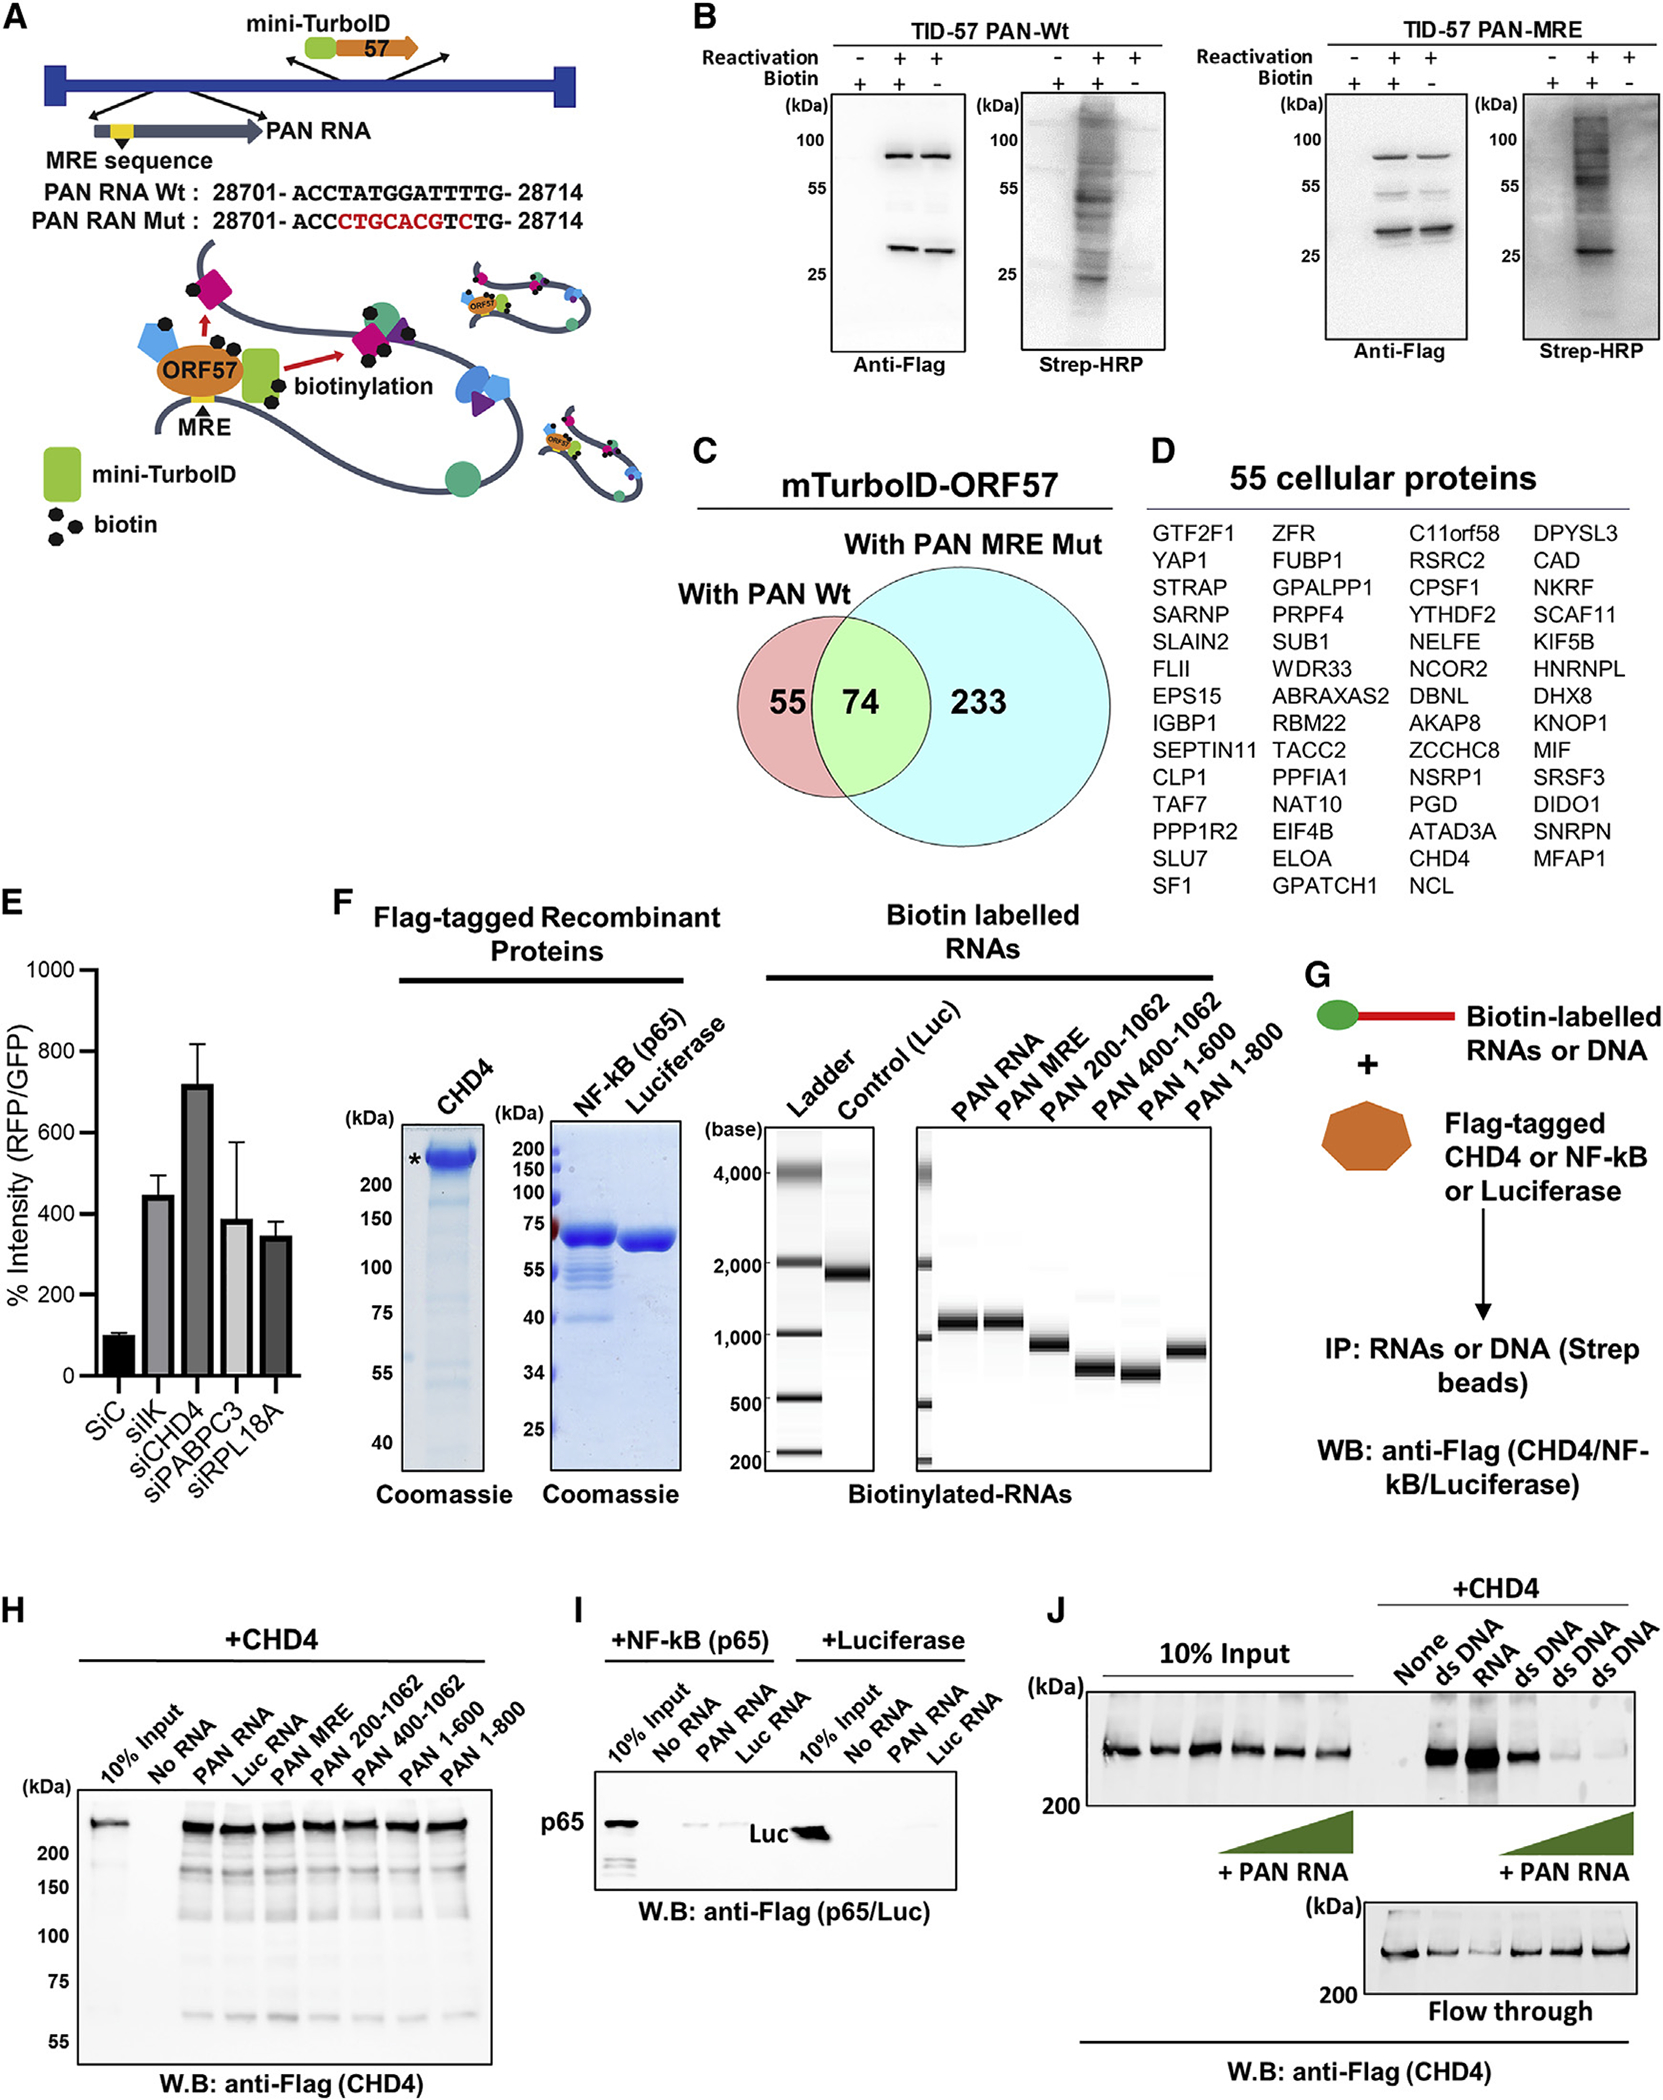
Figure 5. CHD4 is an RNA and DNA binding protein.

(A) A schematic diagram of recombinant KSHVs.
(B) Recombinant KSHV-infected iSLK cells (TID-57 PAN Wt and MRE) were either untreated or induced for reactivation with doxycycline (1 μg/mL) and TPA (20 nM) for 24 h. Blots were probed with either anti-Flag antibody (for mini-TurboID-ORF57) or Streptavidin-HRP (for biotinylated proteins).
(C) The Venn diagram indicates the number of identified proteins with a p value less than 0.05.
(D) The proteins found enriched in PAN RNA WT samples are shown. The entire list of proteins and peptide counts are presented in Table S2.
(E) Recombinant KSHV reactivation, which encodes RFP under control of the PAN RNA promoter, was used to screen the effects of KSHV reactivation. RFP signal intensity was measured with ImageJ, and the GFP signal was used as internal controls. Three randomly selected fields in the middle of each well were quantified and the average intensity was plotted. (F) Recombinant Flag-tagged proteins were expressed with baculovirus and purified with Flag-agarose beads. Coomassie staining of Flag-CHD4, Flag-NF-kB (p65), and Flag-luciferase used for pulldown studies are shown.
(G) Schematic for in vitro interaction assay performed in (H–J).
(H) RNA pulldown was performed with the indicated biotinylated PAN RNA deletions, mutation (MRE), and irrelevant RNA (luciferase mRNA), and interaction was probed by immunoblotting with anti-Flag antibody. Beads alone (No RNA) was used for background control.
(I) RNA pulldown was performed with indicated biotinylated RNAs, and p65 and luciferase (Luc) were visualized by using anti-Flag antibody.
(J) Pulldown analyses with biotinylated ssRNA or dsDNA was performed. CHD4 (100 nM) was incubated with biotinylated RNA (100 nM) or biotinylated dsDNA (100 nM) in 40-μL binding buffer. Increasing amounts of non-biotinylated PAN RNA at 1:1, 1:10, and 1:20 (dsDNA versus ssRNA) were also incubated, and precipitated CHD4 protein in the pulldown was probed with anti-Flag antibody.
Flow-through and 10% of the input reaction before pulldown were used as control. (B, E, F, and H–J) n = 3 biological replicates, and one representative is shown.
(E) Data are presented as mean ± SD. (C) Each protein ID was performed with three biological replicates.
