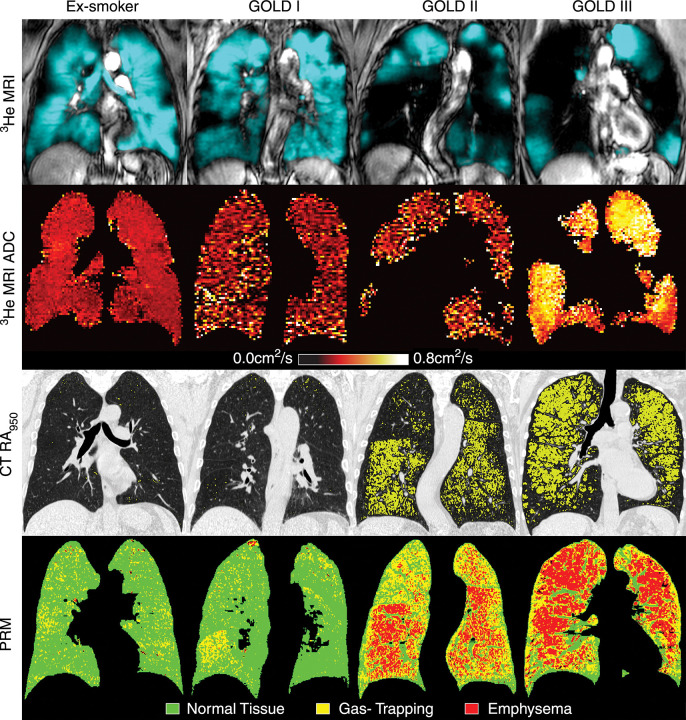
Figure 1.
Ventilation and PRM of (1) a 55-year-old male without COPD (FEV1, 83% of predicted value; FEV1/FVC, 77%; residual volume to total lung capacity ratio [RV/TLC], 45%) (2) a 69-year-old male with GOLD I disease (FEV1, 89% of predicted value; FEV1/FVC, 69%; RV/TLC, 39%; DLCO, 67% of predicted value) (3) an 84-year-old male with GOLD II disease (FEV1, 52% of predicted value; FEV1/FVC, 44%; RV/TLC, 62%; DLCO, 47% of predicted value), and (4) a 67-year-old female with GOLD III disease (FEV1, 33% of predicted value; FEV1/FVC, 39%; RV/TLC, 72%; DLCO, 28% of predicted value). First row: 3He MR images co-registered with 1H MR images (grayscale) show static ventilation (blue areas). Second row: 3He MR imaging ADC maps show that ex-smokers with more advanced COPD (GOLD II/III disease) have elevated ADC values. Third row: CT attenuation masks show areas of less than −950 HU (yellow areas). Fourth row: PRMs show areas of healthy tissue (green), gas trapping (yellow), and emphysema (red). Permission was obtained from reference number 12 (RSNA provide the permission). ADC, apparent diffusion coefficient; COPD, chronic obstructive pulmonary disease; HU, Hounsifield unit; PRM, parametric response map

