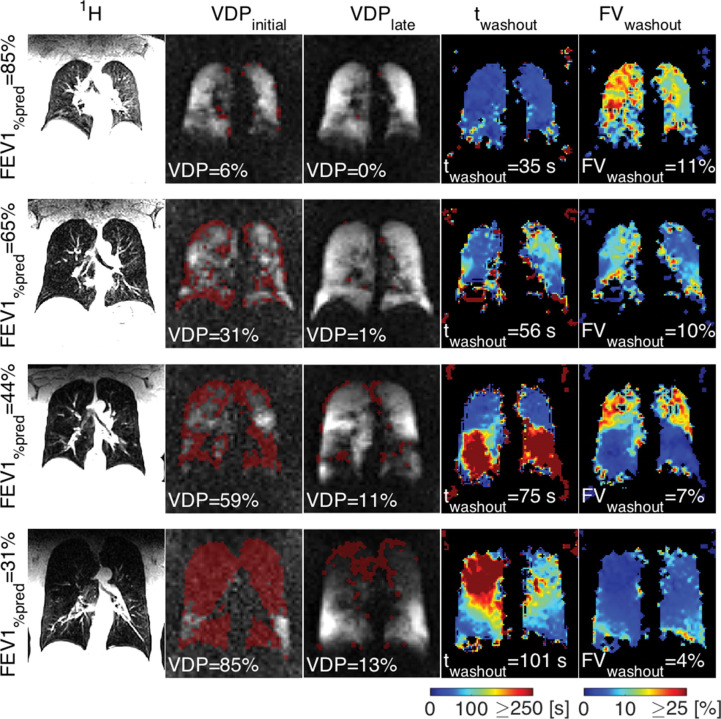
Figure 3.
Images show examples of morphologic imaging, initial and late 19F gas wash-in MR imaging with ventilation defect (red masks), and maps of wash-out times and FV assessed with dynamic 19F gas wash-out MR imaging for the different severities of COPD indicated by percentage predicted FEV1 (FEV1% predicted; corresponding to GOLD stages I–IV). VDP at initial gas wash-in MR imaging and median wash-out time increase and correspondingly median FV decreases with an increase in severity of COPD. Additionally, gas wash-out parameter maps show an increase in heterogeneity of regional lung ventilation with progression of disease. Permission was obtained from reference number 54 (RSNA provides the permission). COPD, chronicobstructive pulmonary disease; FV, fractional ventilation; VDP, volume defectpercentage.

