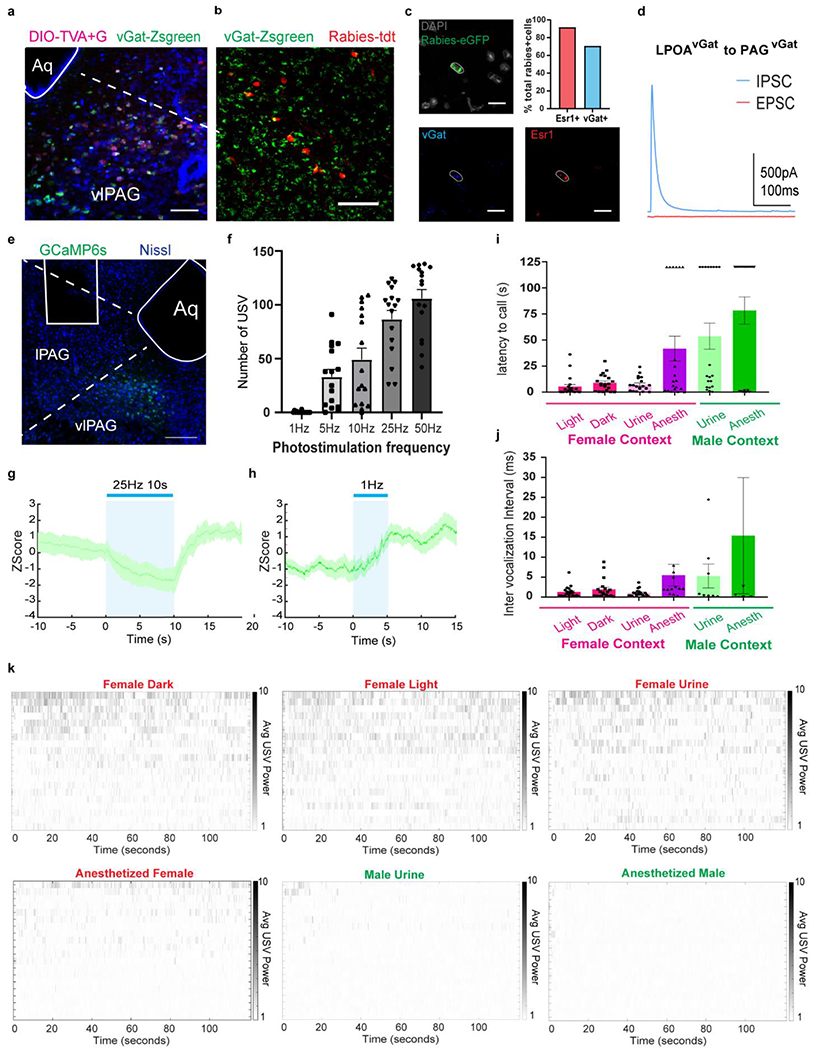
Extended Data Figure 8. LPOAvGat cell population connect to PAGcGat cell population both anatomically and functionally; and the number of USV syllables and latency flexibly varies with social context.

a, example image of PAG section for experiment described in Fig. 2f–g. Starter cells (magenta) overlap with vGat-Zsgreen. Scale bar = 100μm. Aq = Aqueduct. b, sample image of LPOA section for experiment described in main Figure 2f–g showing overlap of Rabies-tdt positive cells (red) with vGat-Zsgreen. (272/320 cells counted, N=3 mice, total of 17 sections. Scale bar = 200μm. c, example image of RNAScope multiplex in situ hybridization in LPOA to complement main Figure 2c. Sections are stained with eGFP (green), vGat (blue) and Esr1(red) probes. Scale bar = 25μm. The majority of LPOA neurons that projected to PAGvGat co-express Esr1. N=2 animals, total of 16 sections (20um thick) collected. Top right panel: quantification of rabies positive cells overlapping with vGat+ or Esr1+ using RNAScope multiplex in situ hybridization. N=2 animals, total 24 rabies positive cells quantified. d, PAGvGat cells receive monosynaptic IPSC from LPOAvGat/ChR2 neurons. IPSC and EPSC evoked by single light pulse, N=5 animals, 16 cells recorded. e-h,To study the in vivo effects of LPOAEsr1 activity we expressed both ChR2 in the LPOA and GCaMP6s in the PAG of vGat-Cre mice (LPOAvGat/ChR2;PAGvGat/GCaMP6s). Photostimulation in the LPOA of awake behaving mice resulted in a decrease in fiber photometry measured GCaMP6s fluorescence in the local PAG inhibitory neurons and an accompanying initiation of USV production. E) representative image of fiber track and viral expression of GCaMP6s in PAG. Scale bar = 200μm. N=4 animals, 3 sections/animals collected. F) number of USV syllables emitted following light stimulation of LPOAvGat/ChR2 neurons while recording of PAGvGat/GCaMP6s signals. Mean ± s.e.m. N=4, 16 trials per condition. g) mean z-score of fiber photometry signal from PAGvGat/GCaMP with 25Hz 10s photostimulation of LPOAvGat/ChR2 cells. h) mean z-score of fiber photometry signal from PAGvGat/GCaMP with 1Hz 5s photostimulation of LPOAvGat/ChR2 cells, where the photostimulation is below the threshold to produce USVs. Solid line indicates mean of signals and shaded region indicates 95% confident intervals. N=4 animals, 3 trials/animal. i-k, to study the extend of USV syllables flexibility during natural social behavior, we collected wild-type male mice USV during difference social context. Wild-type male USVs were recorded during 2 minute interactions with a variety socially relevant sensory contexts including awake female (in dark or light), female urine, anesthetized female, male urine, or an anesthetized male. Flexibility of social vocalization is underscored by the longer and louder USV-bouts triggered by awake behaving females compared to the USVs evoked by anesthetized females even though much of the contextual sensory cues are similar. i) latency to first USV evoked by different sensory contexts. J) average inter vocalization intervals (IVIs) of USVs evoked by different sensory stimuli. Red bar = female context (live female in either the dark with red light or bright light, female urine, anesthetized female); green bar, male context (male urine, anesthetized male). Mean ± s.e.m. N=20 animals. k) raster plot of USVs emitted while interacting with different sensory contexts. Each line is a single wildtype male. Average USV power is calculated by mean dB in 40-90kHz band from raw recording.
