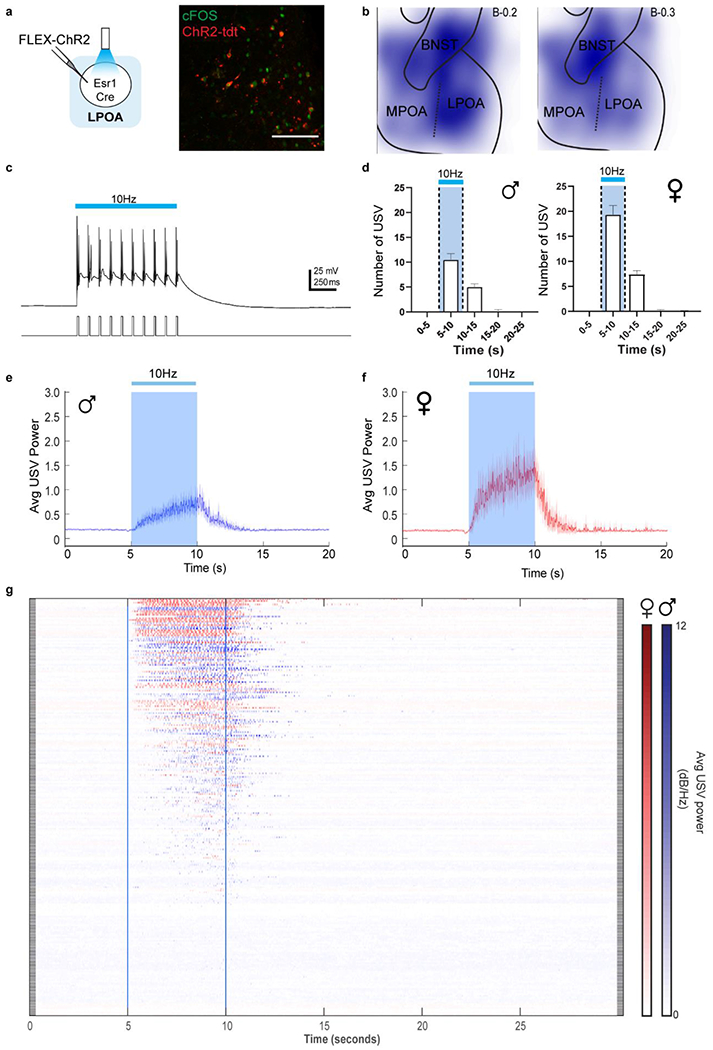
Extended Data Figure 3. Optogenetic stimulation of LPOAEsr1/ChR2 neurons triggers USV calling in both male and female mice.

a, Left; ChR2 virus injection in LPOA region of Esr1-Cre mice. Right; Sample image of ChR2 and cFos co-expression following photostimulation. Scale bar = 50μm. b, viral expression in LPOA region. Composite overlay of total sections at left; bregma-0.2mm and right: bregma-0.3mm. Color intensity scales with increasing expression. N=12 animals. c, example electrophysiology recording during photostimulation of LPOAEsr1/ChR2 neurons in ex vivo slice. Blue bar = 10Hz light stimulation. Neural response is time-locked to light pulses. d, number of USVs detected during 10Hz photostimulation of LPOAEsr1/ChR2 cells from left; males (N=23 animals) and right; females (N=11 animals) Mean ± s.e.m. e-f, average dB across 40-90kHz band evoked by 10Hz photostimulation. Solid line indicates mean of all trials; shaded region indicates 95% confidence interval. e) blue trace: male trials, f) red trace: female trials14,46. Blue shading/bar = light stimulation at 5-10 seconds. g, raster plot of complete data set showing USV power evoked by 10Hz 5s 15ms photostimulation (between blue lines) from LPOAEsr1/ChR2 females (N=11 animals, red) and males (N=23 animals, blue), N = 242 trials, each row is a single trial. Color intensity represents average dB across the ultrasonic band (40-90kHz). Discussion note: the POA has been implicated in a variety of functions including homeostatic control of internal states such as thermoregulation and thirst, sexually dimorphic social behaviors including parenting and mating behavior, as well as motivated behaviors39,47–49. It is likely that features of these neurons that enable them to generate USVs in the absence of social stimuli in the lab also enable them to participate in other neural computations that are currently unknown.
