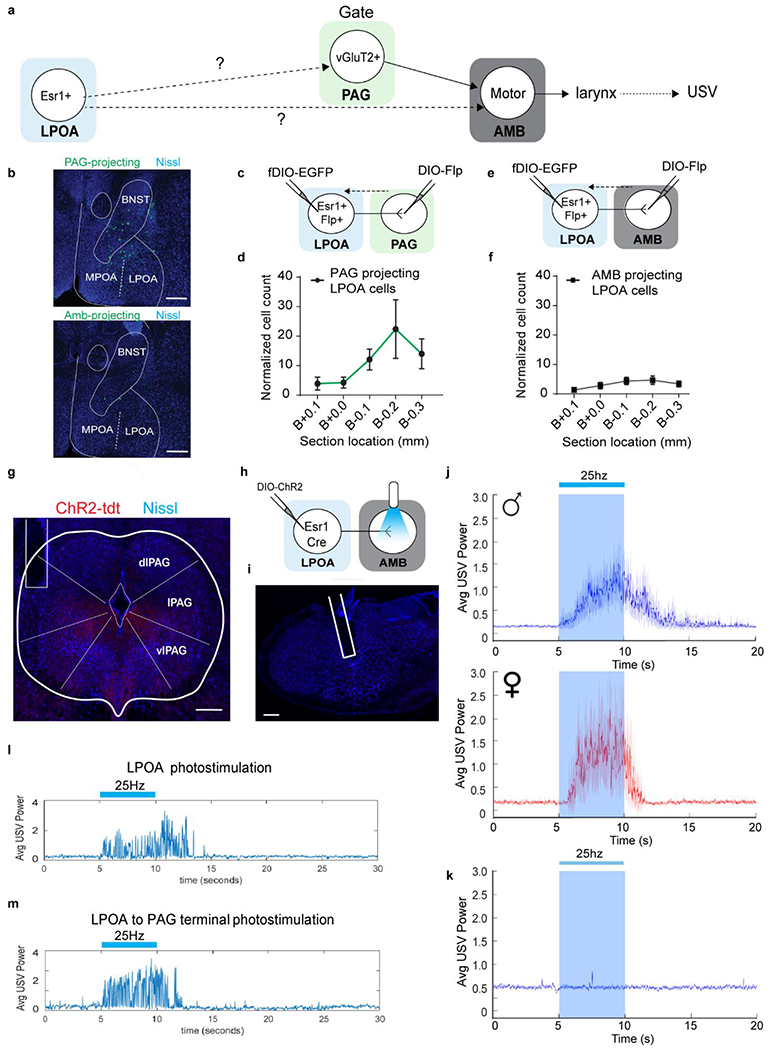
Extended Data Figure 5. LPOAEsr1 projections to USV motor center (ambiguous) are sparse and unable to be functionally validated while LPOAEsr1 projections to PAG produces robust USV production.

a, strategy to test whether LPOAEsr1 neurons are anatomically or functionally connected to either the PAG or the Amb which are known to evoke USV calling in the mouse16,17,50,51. b-f, retrograde tracing experiment from either PAG or AMB to label LPOAEsr1 cell projections by injecting a Cre-dependent FLP-expressing pseudotyped equine infectious anemia virus (RG-EIAV-DIO-Flp) in either the PAG or Amb, and a FLP-dependent AAV expressing eGFP in the LPOA of Esr1-Cre mice32,33. We confirmed the specificity of viral expression by multiplex fluroscent in situ hybridization (Extended Data Figs. 6a–b). We observed sparse labeling of LPOA cells that directly project to the Amb, and a larger population centered in the LPOA region of cFos/Esr1 overlap that directly project to the region of the PAG USV-gate neurons. b) example image of PAG-projecting (top) or Amb-projecting (bottom) eGFP positive cells in LPOA as described and quantified in c-f. Scale bar = 200 μm. N=5 animals, 5 sections/animal collected. c-d, anatomic tracing from PAG to LPOA resulted in robust labeling. c) experimental design to express DIO-FLP virus in PAG and fDIO-eGFP in LPOA of Esr1-Cre mice. d) restrocaudal distribution of total number of PAG-projecting eGFP positive cells in the LPOA. Mean ± s.e.m. N=5 animals. e-f, anatomic tracing from Amb to LPOA resulted in sparse labeling. e) experimental design to express DIO-FLP virus in Amb and fDIO-eGFP in LPOA of Esr1-Cre mice. f) restrocaudal distribution of total number of Amb-projecting eGFP positive cells in the LPOA. Mean ± s.e.m. N=5 animals. To test if either of these projections function to evoke USV calling, we expressed ChR2 in the LPOA of Esr1-Cre mice and photostimulated from axon terminals in either the PAG or Amb. g, sample image of optical fiber position for stimulation of LPOAEsr1/ChR2 terminals in PAG show in panel j. h, experimental design for stimulation of LPOAEsr1/ChR2 terminals in Amb. i, sample image of optical fiber position for terminal stimulation at Amb. Scale bar = 200μm. N=5 animals, 4 sections/animal collected. j, average USV power across 40-90kHz band of recording during PAG terminal stimulation, solid line indicates the mean and shaded region indicate 95% confident interval. (blue shading, N=13 male animals. Red shading, N=4 female animals. 4 trials/animal.) k, average USV power across 40-90kHz band of recording during Amb terminal stimulation, solid line indicates the mean and shaded region indicate 95% confident interval. (Blue shading, N=5 male animals. 4 trials/animal.) l-m, average USV power during single trials of the same male stimulated with 25Hz 5s from either l) LPOAEsr1/ChR2 cell somas, or m) LPOAEsr1/ChR2 axon terminals in the PAG.
