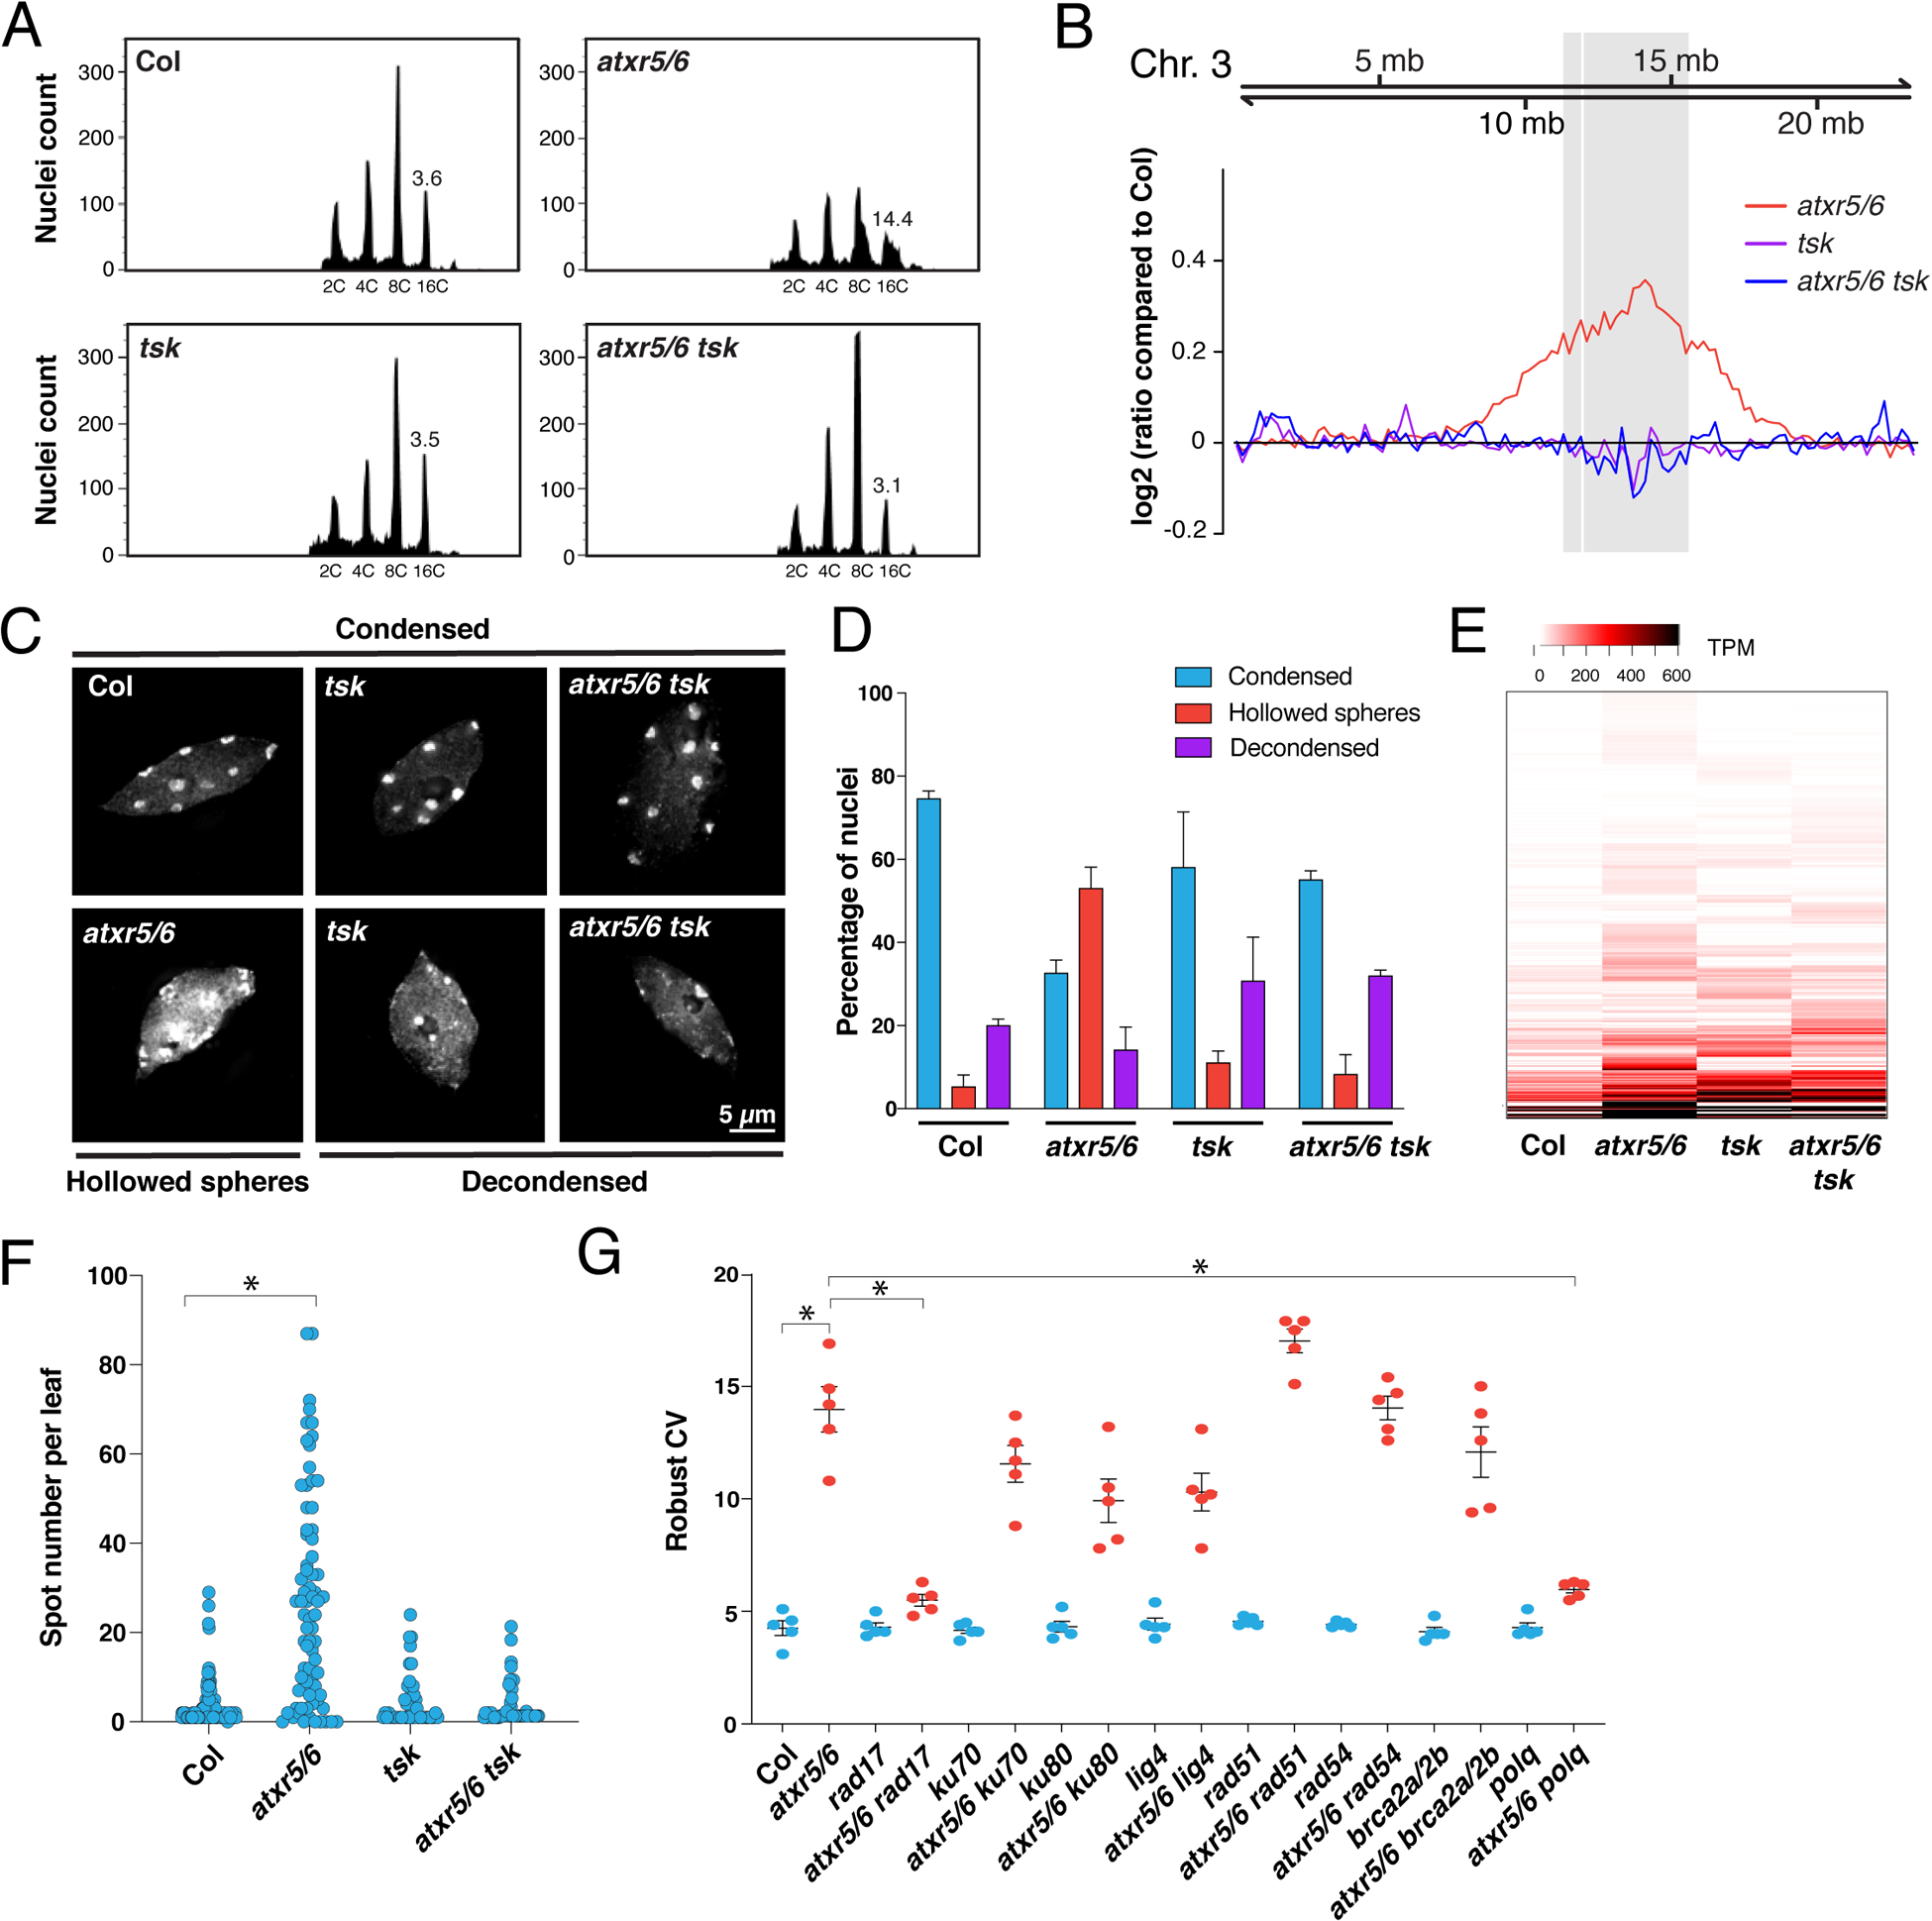
Figure 3. Mutations in TSK suppress heterochromatin amplification of atxr5/6 mutants.

(A) Flow cytometry profiles of Col, atxr5/6, tsk and atxr5/6 tsk leaf nuclei. The numbers below the peaks indicate ploidy levels of the nuclei. The numbers above the 16C peaks indicate the robust coefficient of variation (rCV). (B) Chromosomal view (Chromosome 3 of A. thaliana) of DNA sequencing reads from sorted 16C nuclei. The pericentromeric region is highlighted in gray. (C) Leaf interphase nuclei of Col, atxr5/6, tsk and atxr5/6 tsk stained with DAPI. (D) Quantification of nuclei from experiment shown in panel C. Error bars indicate SEM. (E) Heat map showing the relative expression levels of atxr5/6-induced TEs as measured by TPM (transcripts per million). (F) Average number of blue spots per leaf in Col and atxr5/6 mutants as determined using a GUS reporter for homologous recombination. Error bars represent SEM. Welch’s ANOVA followed by Dunnett’s T3 test: * p < 0.0001. (G) rCV values for 16C nuclei obtained by flow cytometry analyses. Each dot represents an independent biological replicate. Horizontal bars indicate the mean. Error bars represent SEM. Welch’s ANOVA followed by the Dunnett’s T3 test: * p < 0.05.
