
Figure 1. Illustration of beat-to-beat SBP measurements with the same mean but different levels of complexity and variability.
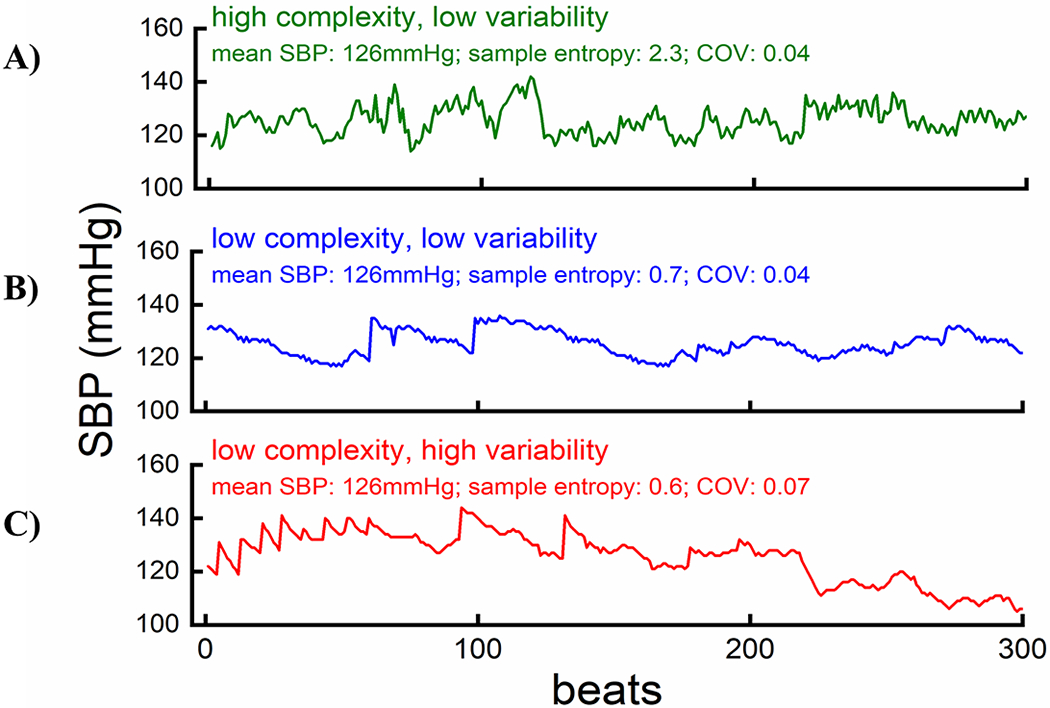
Hypothetical Interpretation: Panel A visualizes the scenario of intact BP regulation, in which numerous and hormonal feedback mechanisms are making flexible adaptations sensitively, manifested as many small disturbances on the waveform, to minimize BP variability (high complexity and low variability). Panel B visualizes the scenario in which the complex interactions between multiple regulatory feedback loops are partially impaired, but BP variability can still be largely limited through compensatory mechanism (low complexity and low variability). Panel C visualizes the scenario in which the complex feature of BP regulation is further impaired and BP variability cannot be effectively buffered by compensatory mechanism (low complexity and high variability).