Figure 3.

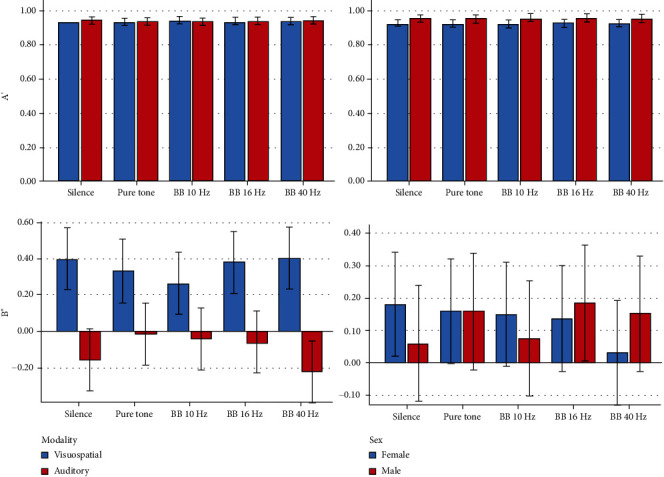
Mean and 95% CIs for the parameters A′ (sensitivity) and B″ (response bias) in each of the modalities and in the sexes, in 5 intervention groups.

Mean and 95% CIs for the parameters A′ (sensitivity) and B″ (response bias) in each of the modalities and in the sexes, in 5 intervention groups.