
Figure 2.
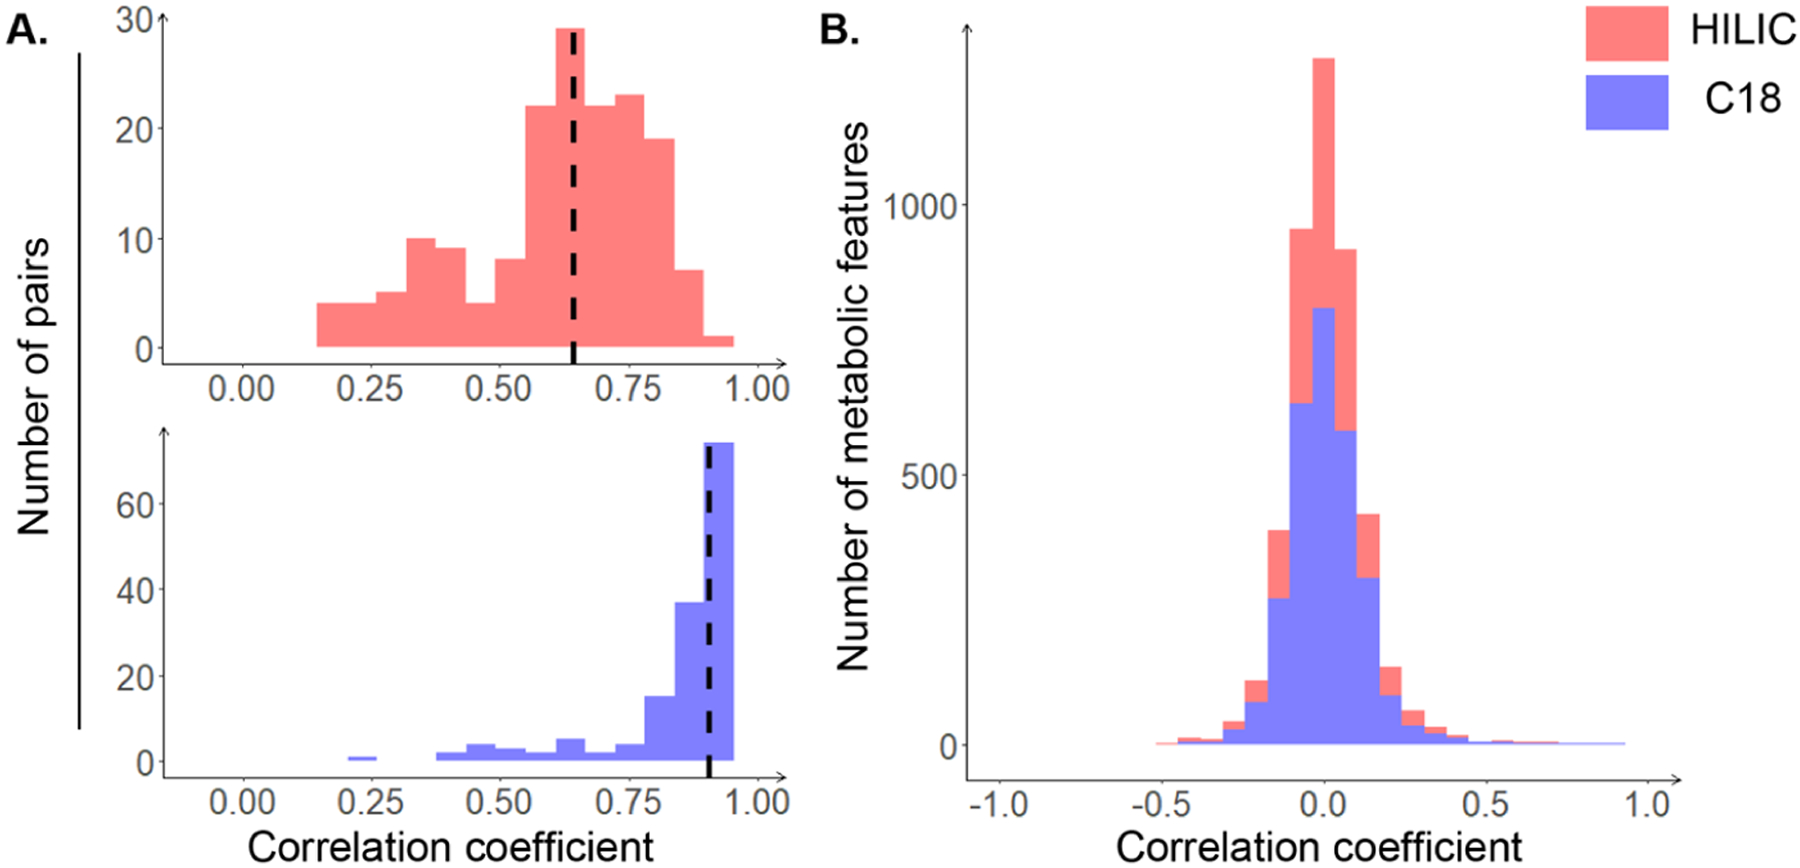
Histogram of Pearson correlation coefficients. (A) Subject-specific correlations: correlations for each pair of plasma and saliva samples across the metabolic features present in both biospecimens. The median correlation coefficient is marked as the dashed line. (B) Feature-specific correlations: correlations for each metabolic feature across all of the participants. The results of HILIC and C18 columns are colored in pink and purple, respectively.