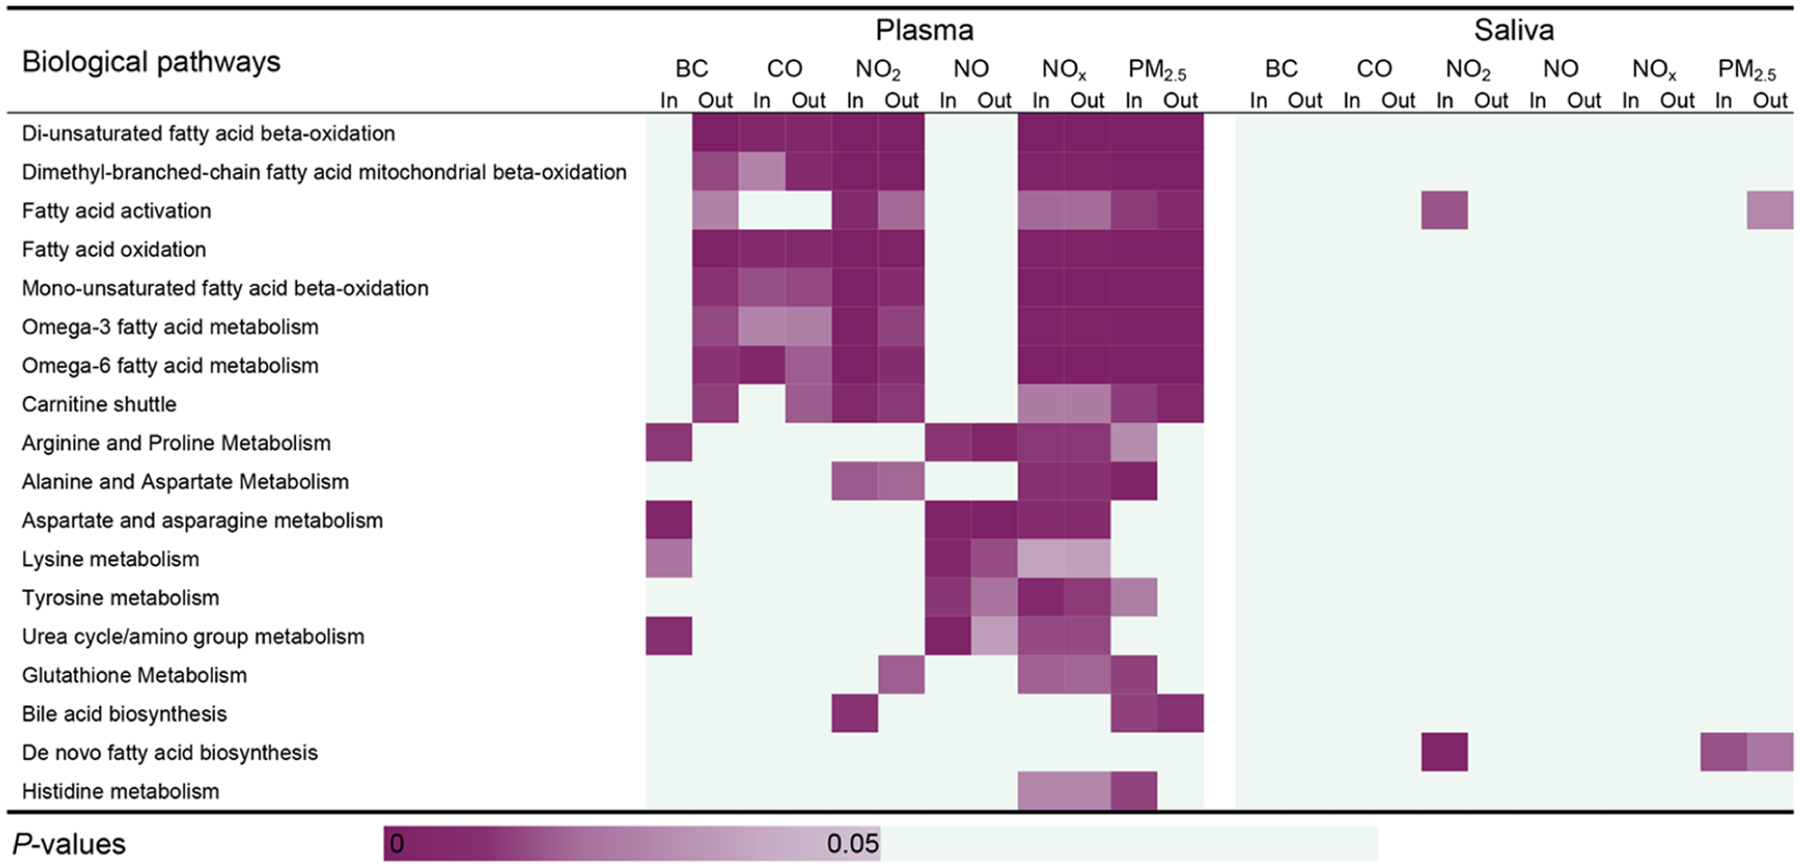
Figure 3.

Metabolic pathways enriched by the metabolic features present in both plasma and saliva by the HILIC column. The cells are shaded according to strength of association (i.e., p value) between each of the metabolic pathways and significant features that were associated with each indoor/outdoor single traffic pollutant indicator. Pathways are ordered according to the total number of the significant pathway-traffic pollutant pairs (p < 0.05) in the HILIC column. Each pathway is enriched by at least three significant annotated overlapping features by either plasma or saliva.
