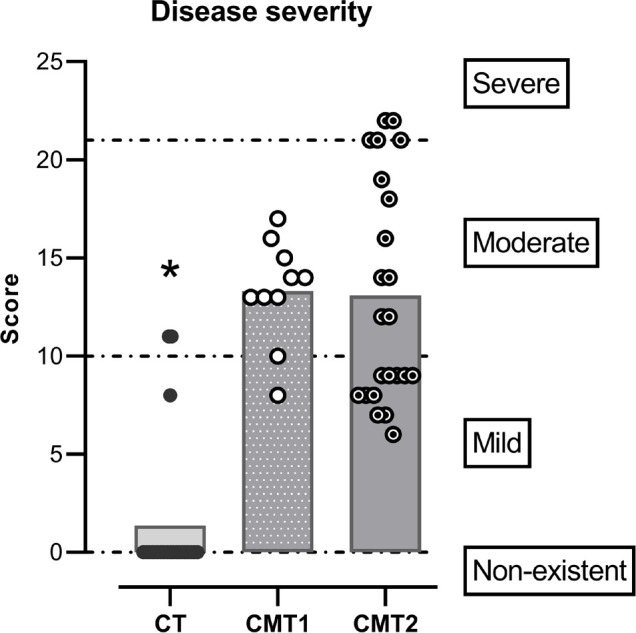
Figure 1.

The severity of disease according to CMTNS score. Each symbol represents the individual score on the scale, the bars the means of each group, and the dotted line the cutoff points for the categories represented on the right. Notes: *Generalized linear model (p<0.05). CT presented lower values than the other groups.
