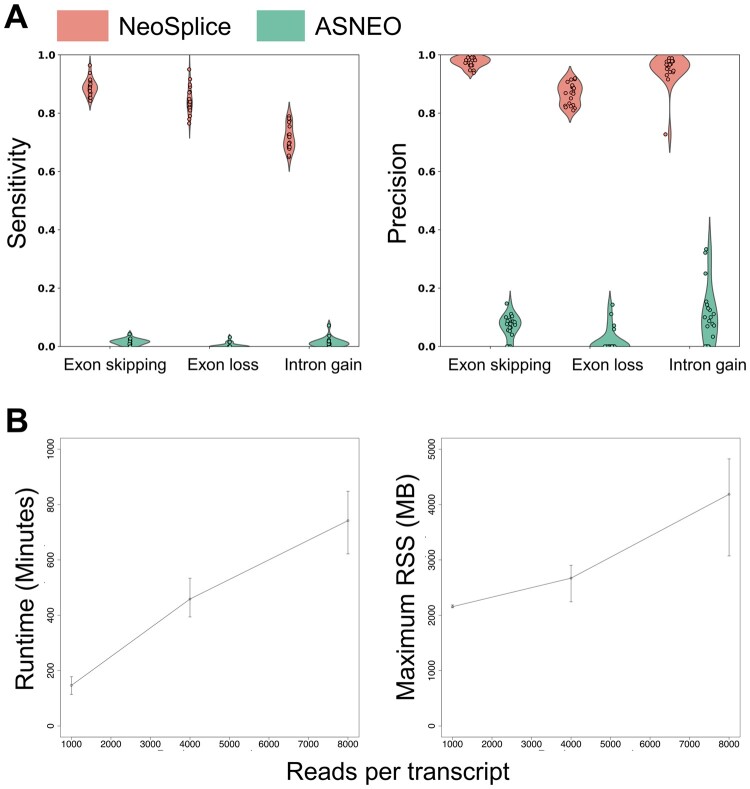
Fig. 2.
Performance and resource usage of NeoSplice on simulated data. (A) Sensitivity and precision for simulated splice variant transcripts, including those derived from exon skipping, exon loss, or intron gain. Values represent the mean performance across 22 chromosomes (up to 5 splice variant junctions per chromosome) for each of 20 total simulated samples. (B) Average runtime (left) and max resident set size (RSS; right), with error bars representing the maximum and minimum times across three simulated samples. Runtime is defined as the elapsed time and RSS is the amount of memory requested by NeoSplice from the operating system as reported by the ‘sacct’ command, as measured on an Intel Xeon ES-E5620 2.4 GHz CPU or ES-E5520 2.27 GHz CPU

