
Fig. 3.
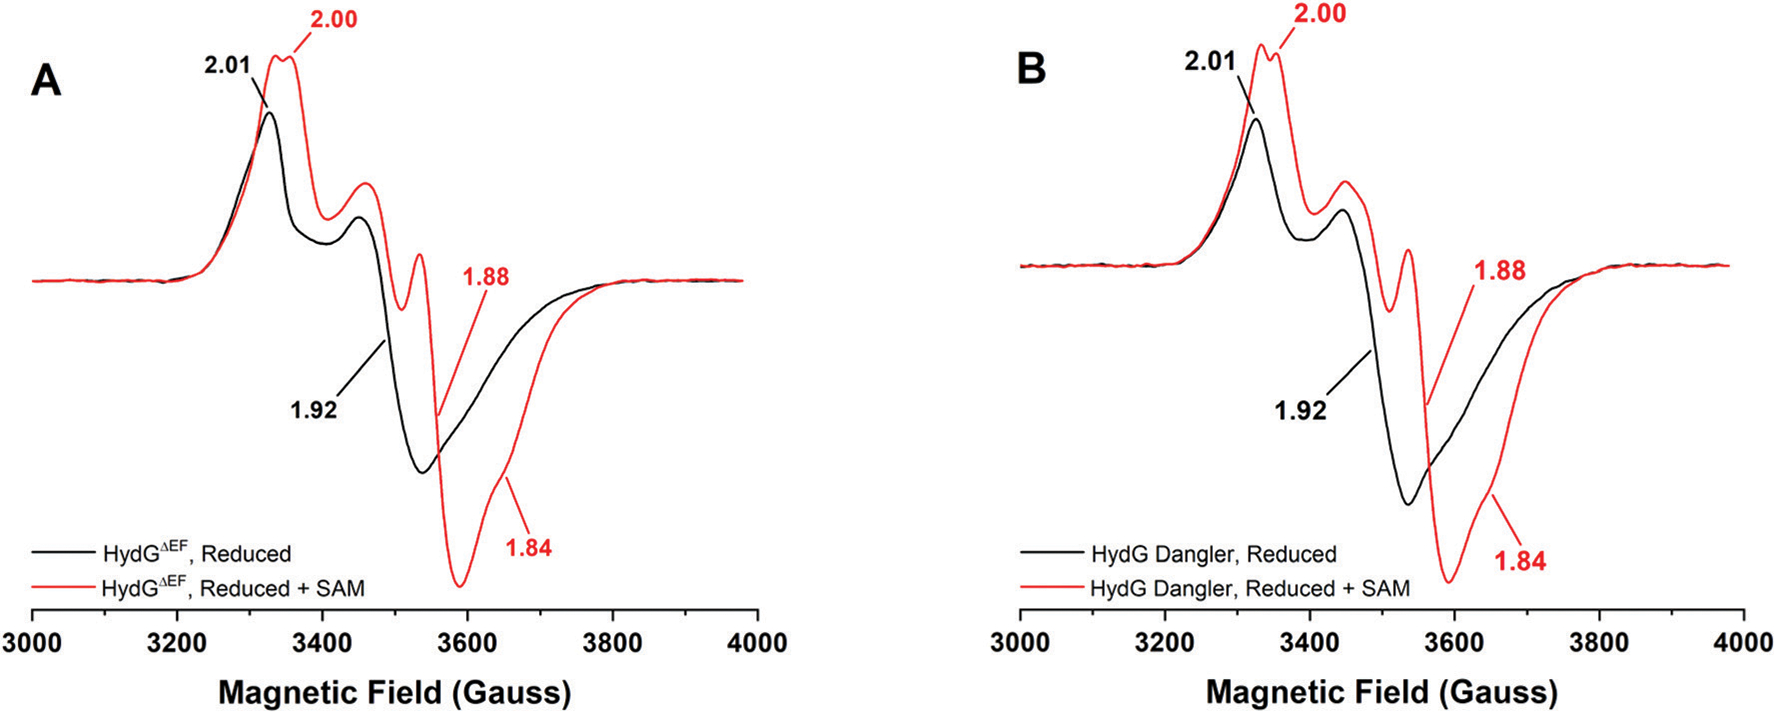
Low temperature (10.0 K, 1 mW), CW X-band EPR spectra of C.a. HydG. A. WT traditionally reconstituted HydGΔEF (68 μM protein with 7.54 ± 0.48 Fe per protein). B. WT dangler reconstituted HydGΔEF (60 μM protein with 8.23 ± 0.43 Fe per protein). In both panels, black spectra correspond to enzyme treated with 3 mM DT, while red spectra correlate to treatment with 3 mM DT and 2 mM SAM.