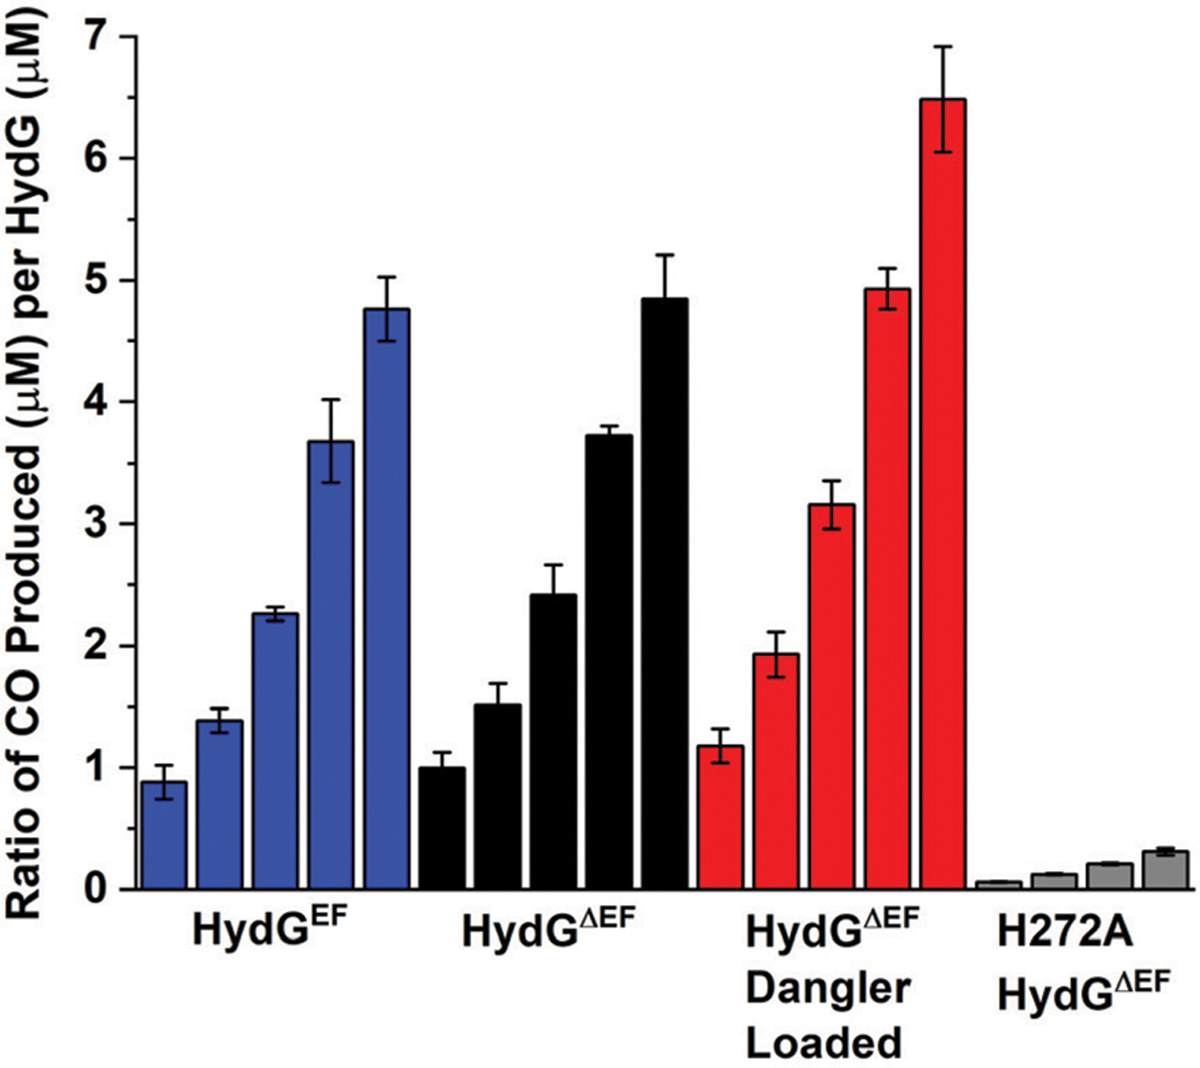
Fig. 5.

CO formed per HydG during kinetics experiments (analysis based on ΔAbs at λ = 425 nm). Each subset of bar graphs depicts the ratio of CO : HydG at 15 min, 30 min, 60 min, 120 min, and 240 min (H272A data set lacks the 240 min time point). The blue subset of bar graphs correspond to experiments performed with WT traditionally reconstituted HydGEF (7.38 ± 0.40 Fe per protein). The black subset of bar graphs correspond to experiments performed with WT traditionally reconstituted HydGΔEF (7.54 ± 0.48 Fe per protein). The red subset of bar graphs correspond to experiments performed with WT dangler reconstituted HydGΔEF (8.23 ± 0.43 Fe per protein). The gray subset of bar graphs correspond to experiments performed with traditionally reconstituted HydGH272A. The color scheme of the data in this figure for particular HydG preparations matches what is depicted in Fig. 2B. Assays conducted in 50 mM Tris, 10 mM KCl, pH 8.1 buffer.
