
Fig. 7.
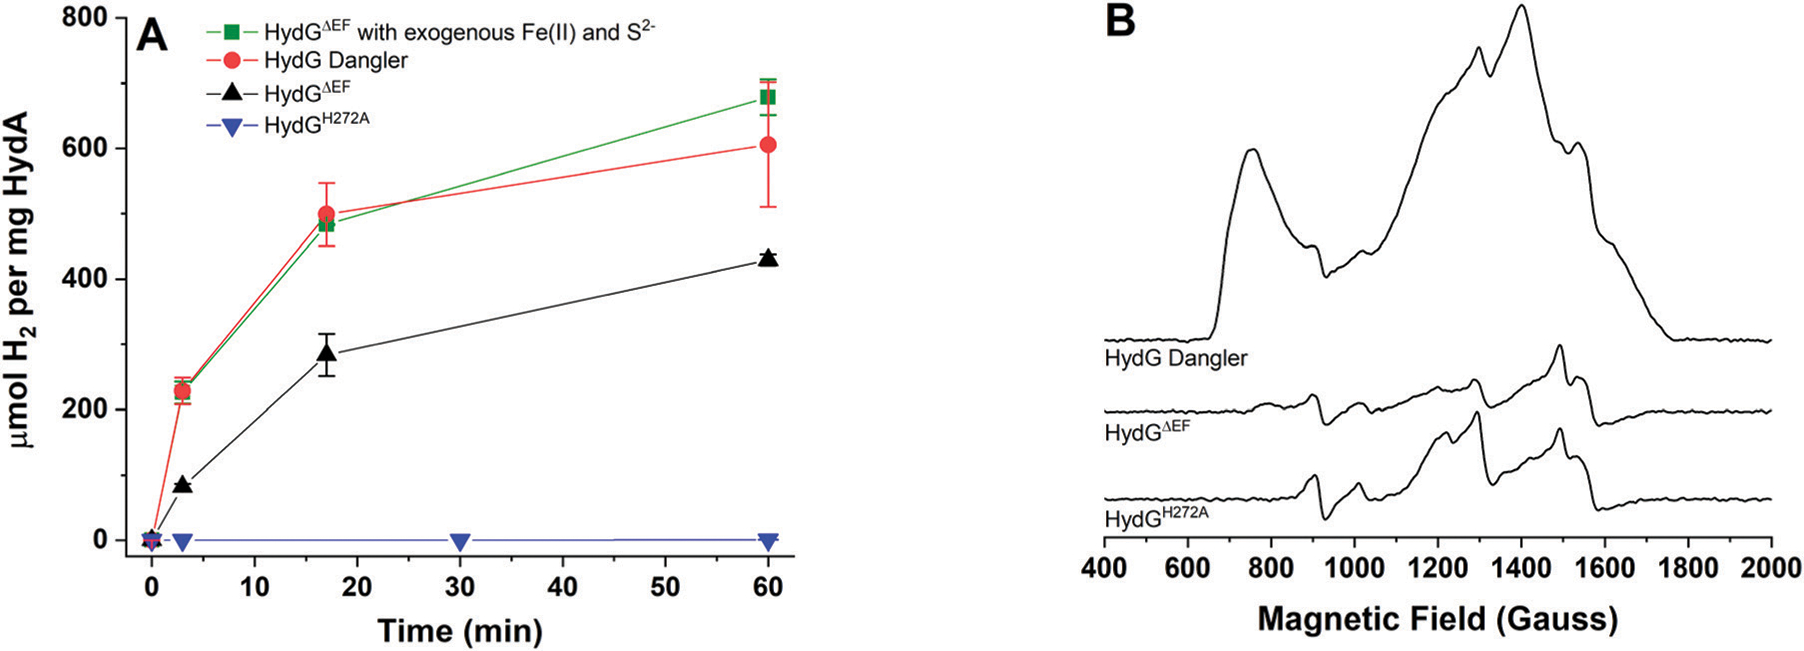
In vitro maturation correlated to HydG dangler iron incorporation. A. HydAΔEFG H2 assays following in vitro activation with HydG containing trace amounts of dangler assayed with no added Fe2+ and S2− (black), trace amounts of dangler in the presence of excess Fe2+ and S2− (green), dangler-loaded HydG with no added Fe2+ and S2− (red), or with HydGH272A (blue) B. CW, X-band EPR spectra recorded at 8.0 K and 5.3 mW microwave power for HydG preparations reduced with 3 mM DT. Spectra correlate to the protein samples assayed in panel A: dangler reconstituted HydGΔEF (100 μM, 8.1 ± 0.8 Fe per protein); HydGΔEF (90 μM, 7.7 ± 0.7 Fe per protein); HydGH272A (96 μM, 8.0 ± 0.1 Fe per protein).