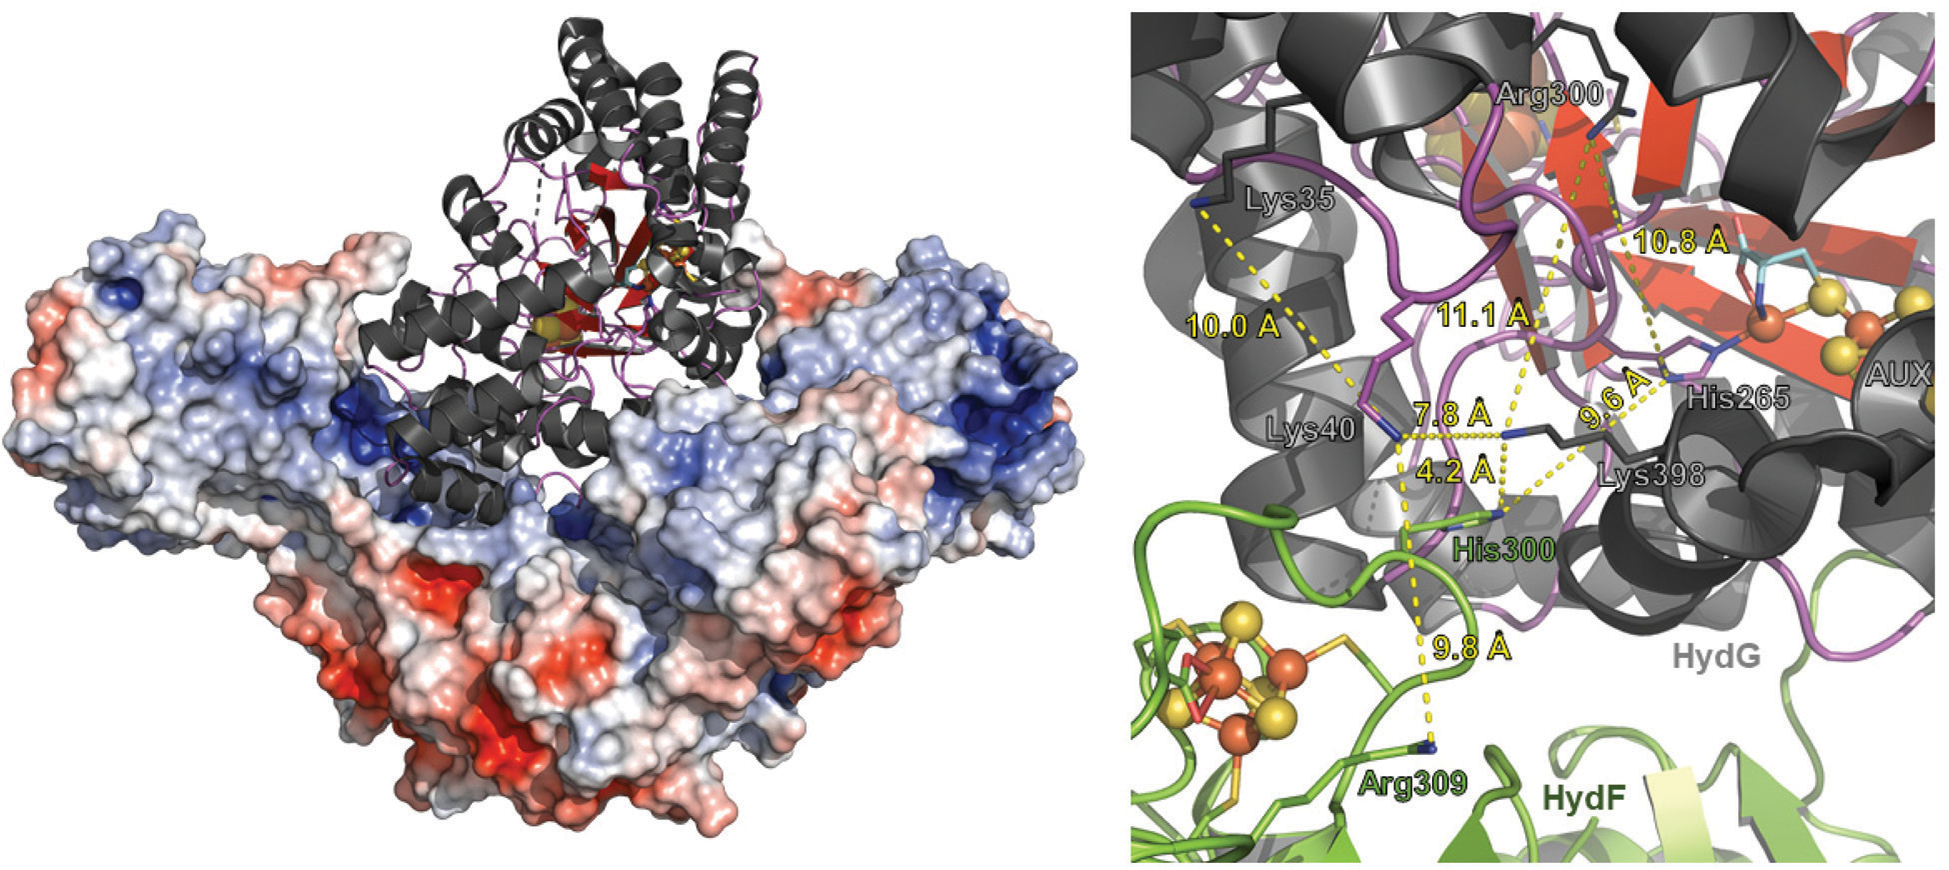
Fig. 8.

Molecular docking model between Thermosipho melanesiensis HydF (5KH0.pdb) and Thermoanaerobacter italicus HydG (4WCX.pdb). (Left) Overall docked structure showing dimeric HydF represented as an electrostatically colored (red, negative charge; blue, positive charge), space filled model. HydG is depicted as a ribbon diagram (α-helix, black; β-strands, red; loop, purple; Fe, orange; and S, yellow). The global contact area between HydG and HydF in the docked structure is 2214 Å2. Surface electronic calculations were carried out using the APBS plugin in PyMOL version 2.2.3 (The PyMOL Molecular Graphics System, Schrödinger, LLC). (Right) Close up view highlighting the interaction between HydF (green) and HydG (charcoal). The [Fe–S] clusters are depicted in ball-and-stick mode (Fe, orange; S, yellow). The bridging cysteine residue of the HydG auxiliary cluster is shown in stick mode with C, O, N atoms colored cyan, red, and blue, respectively. Residues of interest are denoted accordingly, and these include three lysines and an arginine on HydG, and a histidine and an arginine on HydF, that may be involved in a CN− transfer pathway from HydG to HydF. Distances between certain residues are highlighted in yellow dashed lines; the distance between the dangler Fe in HydG and the [4Fe−4S] cluster of HydF is 23 Å. The docked model was created using the ClusPro software program.98–101
