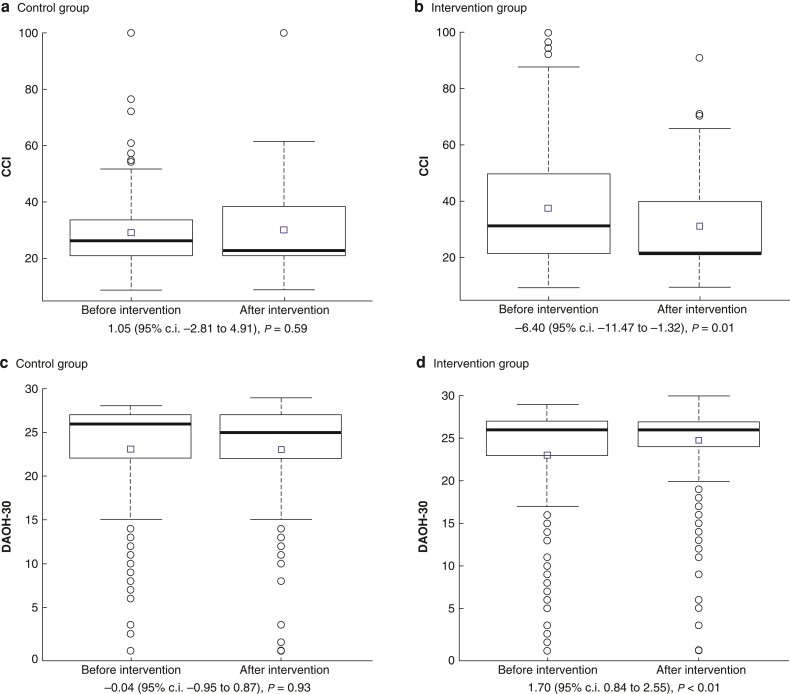
Fig. 2.
Boxplots and results of the ANOVA
Boxplots of the severity of complications measured by the comprehensive complication index and 30-days alive and out of hospital, before and after implementation in the intervention and control group. Results of the ANOVA are shown in the boxes in the top right corner. The square represents the mean and extreme observations by circles CCI, comprehensive complication index; DAOH-30, 30-days alive and out of hospital.

